

Question: 4.14 following are two weekly forecasts made by two different methods for the number of gallons of gas in thousands. also shown is the actual
4.14 following are two weekly forecasts made by two different methods for the number of gallons of gas in thousands. also shown is the actual demand in thousands 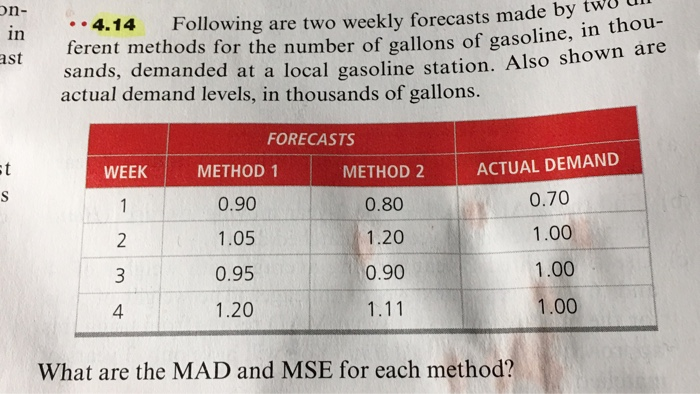
on- in ast ..4.14 Following are two weekly forecasts made ferent methods for the number of gallons of gasoline sands, demanded at a local gasoline station. Also si actual demand levels, in thousands of gallons. ekly forecasts made by two un llons of gasoline, in thou- ine station. Also shown are FORECASTS WEEK METHOD 1 METHOD 2 ACTUAL DEMAND 0.70 0.90 1.00 1.05 0.95 1.20 0.80 1.20 0.90 1.11 1.00 1.00 What are the MAD and MSE for each method what are the MAD and MSE for each method?
Step by Step Solution
There are 3 Steps involved in it
1 Expert Approved Answer
Step: 1 Unlock

Question Has Been Solved by an Expert!
Get step-by-step solutions from verified subject matter experts
Step: 2 Unlock
Step: 3 Unlock