

Question: The MAD for Method 1=______thousands gallons (round your response to three decimal places) The mean squared error (MSE) for Method 1=______thousands gallons^2(round your response to
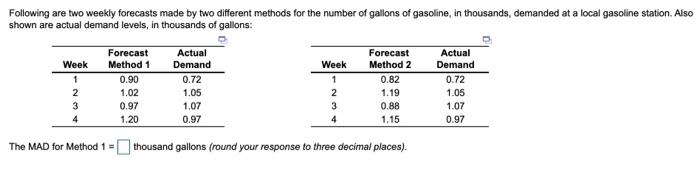
The MAD for Method 1=______thousands gallons (round your response to three decimal places)
The mean squared error (MSE) for Method 1=______thousands gallons^2(round your response to three decimal places)
The MAD for method 2=____thousands gallons (round your response to three decimal places)
The mean squared error (MSE) for Method 2=____thousands gallons^2 (round your response to three decimal places)
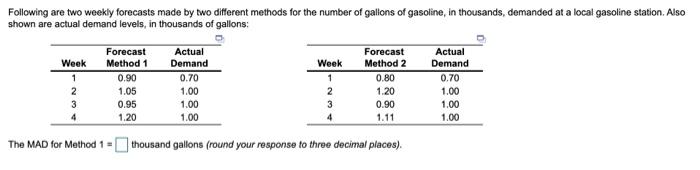
Step by Step Solution
There are 3 Steps involved in it
1 Expert Approved Answer
Step: 1 Unlock

Question Has Been Solved by an Expert!
Get step-by-step solutions from verified subject matter experts
Step: 2 Unlock
Step: 3 Unlock