

Question: 4.2 (5) Draw a scatter diagram. Comment on the type of relation that appears to exist between x and y. (b) Given that x =
4.2
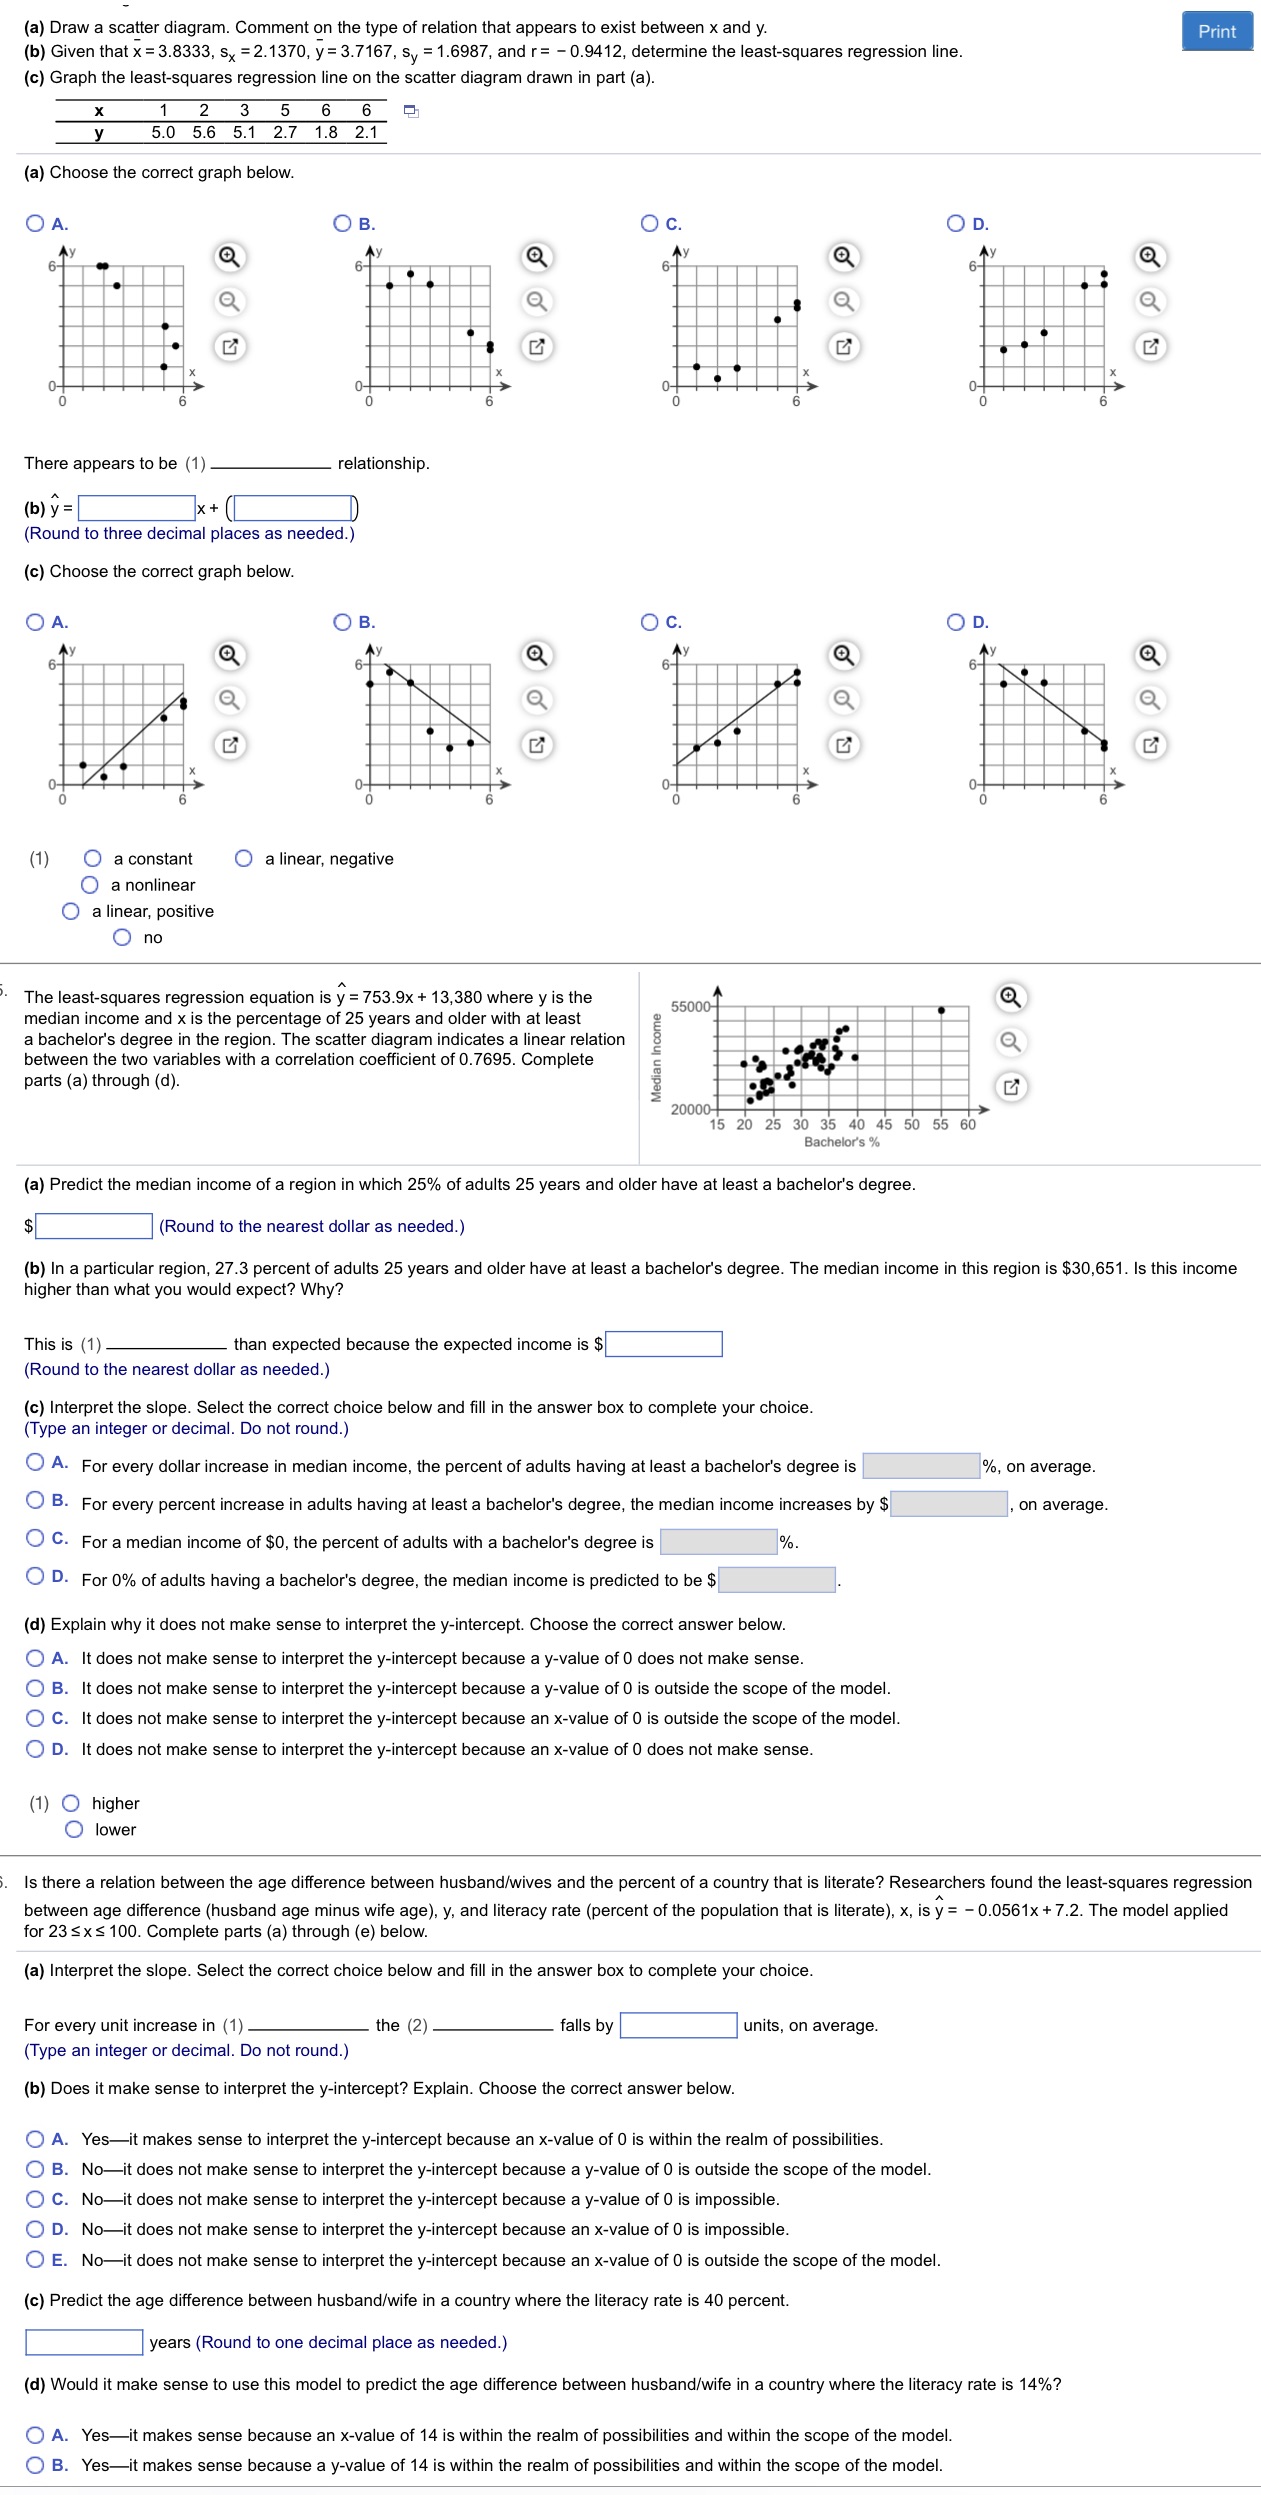
(5) Draw a scatter diagram. Comment on the type of relation that appears to exist between x and y. (b) Given that x = 3.8333. 5x = 2.1370. y = 3.7167. sy =1.6987. and r = - 0.9412. determine the least-squares regression line. (1:) Graph the leastsquares regression line on the scatter diagram drawn in part (a). 2 3 5 6 @ ! 5.0 5.6 5.1 2.7 1.8 2.1 (5) Choose the correct graph below. OA. ' Q ct . o o x x r> D'r __ u 6 n 5 There appears to be (1) relationship. (m9= x+ (Round to three decimal places as needed.) (4:) Choose the correct graph below. 0 A. O B. O C. V Q ct (1) O accnstant O a linear, negative 0 a nonlinear O alinear. positive Ono The least-squares regression equation is y = 753.9x +13,380 where y is the median income and x is the percentage of 25 years and older with at least a bachelors degree in the region. The scatter diagram indicates a linear relation between the two variables with a correlation coefcient of0.7695. Complete parts (a) through (d). Hedi-n lnmme 1520 253035 4045505560 Bamhflt: (a) Predict the median income ofa region in which 25% of adults 25 years and older have at least a bachelor's degree. 5:] (Round to the nearest dollar as needed.) (b) In a particular region, 27.3 percent of adults 25 years and older have at least a bachelors degree. The median income in this region is $30,651. Is this income higher than what you would expect? Why? This is (1) than expected because the expected income is $ (Round to the nearest dollar as needed.) (9.) Interpret the slope. Select the correct choice below and ll in the answer box to complete your choice. (Type an integer or decimal. Do not round.) O A- For every dollar increase in median income. the percent of adults having at least a bachelor's degree is \"/u, on average. O B. For every percent increase in adults having at least a bachelor's degree, the median income increases by $ . on average. 0 C. For a median income of $0. the percent of adults with a bachelor's degree is %. O D- For 0% of adults having a bachelor's degree. the median income is predicted to be $ . (:1) Explain why it does not make sense to interpret the y-intercept. Choose the correct answer below. 0 A. It does not make sense to interpret the y-intercept because a y-value of 0 does not make sense. 0 B. It does not make sense to interpret the y-interoept because a yvalue of 0 is outside the scope of the model. 0 C. It does not make sense to interpret the y-interoept because an x-value of t) is outside the scope of the model. 0 D. It does not make sense to interpret the y-interoept because an x-value of t] does not make sense. (1) 0 higher 0 lower Is there a relation between the age ditterenoe between husbandlwives and the percent at a country that is literate? Researchers found the least-squares regression between age difference (husband age minus wife age). y. and literacy rate (percent of the population that is literate). x. is y = - 0.0561x + 7.2. The model applied for 23 s x s 100. Complete parts (a) through (e) below. (a) Interpret the slope. Select the correct choice below and fill in the answer box to complete your choice. For every unit increase in (1) the (2) falls by (:l units. on average. (Type an integer or decimal. Do not round.) (b) Does it make sense to interpret the y-intercept? Explain. Choose the correct answer below. 0 A. Yesit makes sense to interpret the y-intercept because an x-value of 0 is within the realm of possibilities. O B. Noit does not make sense to interpret the yintercept because a y-value of U is outside the scope of the model. 0 C. Noit does not make sense to interpret the y-intercept because a y-value of U is impossible. O D. Noit does not make sense to interpret the y-intercept because an x-value at D is impossible. O E' Noit does not make sense to interpret the y-intercept because an x-value at D is outside the scope of the model. (9) Predict the age difference between husband/wife in a country where the literacy rate is 40 percent. years (Round to one decimal place as needed.) (d) Would it make sense to use this model to predict the age difierence between husband/wife in a country where the literacy rate is 14%? O A. Yesit makes sense because an x-value ot 14 iswithin the realm of possibilities and within the scope of the model. O B. Yesit makes sense because a y-value of 14 is within the realm of poss ies and within the scope of the model
Step by Step Solution
There are 3 Steps involved in it

Get step-by-step solutions from verified subject matter experts