

Question: 4.2. Use the numerical values in the table below to fit a spherical model on the above (table1) experimental semi-variogram. Distance between samples (m)
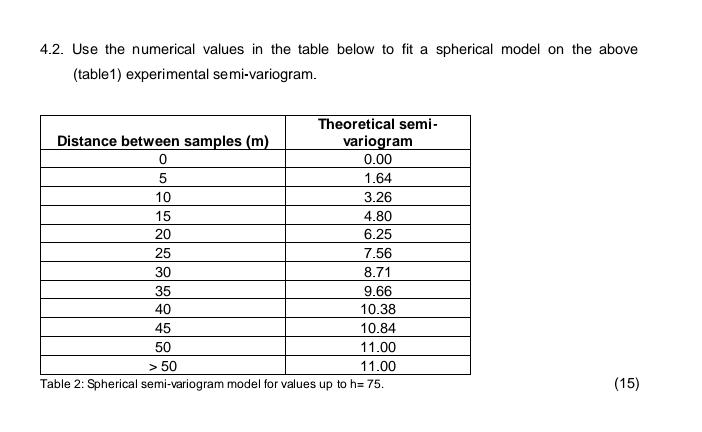
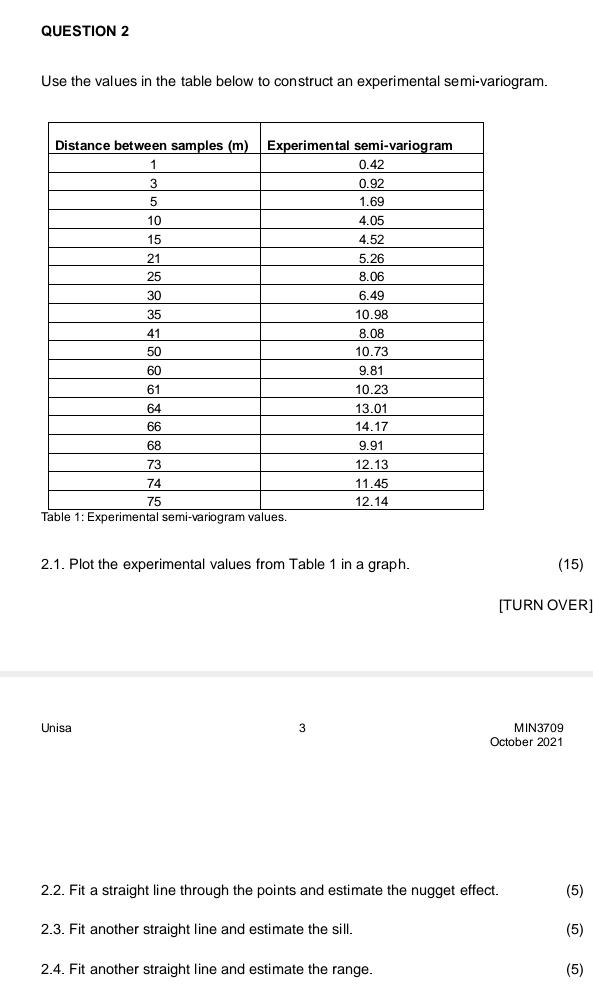
4.2. Use the numerical values in the table below to fit a spherical model on the above (table1) experimental semi-variogram. Distance between samples (m) 0 5 10 15 20 25 30 35 40 Theoretical semi- variogram 0.00 1.64 3.26 4.80 6.25 7.56 8.71 9.66 10.38 10.84 11.00 11.00 Table 2: Spherical semi-variogram model for values up to h= 75. 45 50 > 50 (15) QUESTION 2 Use the values in the table below to construct an experimental semi-variogram. Distance between samples (m) Experimental semi-variogram 1 3 5 10 15 21 25 30 35 41 50 60 61 64 66 68 73 74 75 Table 1: Experimental semi-variogram values. Unisa 0.42 0.92 1.69 4.05 4.52 3 5.26 8.06 2.1. Plot the experimental values from Table 1 in a graph. 6.49 10.98 8.08 10.73 9.81 10.23 13.01 14.17 9.91 12.13 11.45 12.14 (15) [TURN OVER] 2.4. Fit another straight line and estimate the range. MIN3709 October 2021 2.2. Fit a straight line through the points and estimate the nugget effect. 2.3. Fit another straight line and estimate the sill. (5) (5) (5)
Step by Step Solution
3.45 Rating (152 Votes )
There are 3 Steps involved in it
FOR 21 Plot the experimental values from the tabl... View full answer

Get step-by-step solutions from verified subject matter experts