

Question: 4.24 Selected balance sheet and income statement information from CVS Caremark Corp. for 2010 through 2012 follows ($ millions). Total Total Current Current Pretax Interest
4.24
Selected balance sheet and income statement information from CVS Caremark Corp. for 2010 through 2012 follows ($ millions).
Total Total
Current Current Pretax Interest
Assets Liabilities Income Expense Total Liabilities Equity
2012 . . . . . . $19,852 $13,790 $6,323 $557 $28,208 $37,704
2011 . . . . . . 18,594 11,956 5,746 584 26,492 38,051
2010 . . . . . . 17,706 11,070 5,601 536 24,469 37,700
Required
a. Compute times interest earned ratio for each year and discuss any trends for each.
b. Compute the current ratio for each year and discuss any trend in liquidity. Do you believe the company is sufficiently liquid? Explain. What additional information about the accounting numbers comprising this ratio might be useful in helping you assess liquidity? Explain.
c. Compute the total liabilities-to-equity ratio for each year and discuss any trends for each.
d. What is your overall assessment of the companys credit risk from the analyses in (a), (b), and (c)?
4-28
Compute and Interpret Altmans Z-scores (LO5)
Following is selected financial information for eBay Inc., for its fiscal years 2013 and 2012.
($ millions, except per share data) 2013 2012
Current assets ............................................... $23,283 $21,398
Current liabilities...........................................12,639 10,924
Total assets.................................................. 41,488 37,074
Total liabilities ..............................................17,841 16,209
Shares outstanding .......................................1,294 1,286
Retained earnings ..........................................18,854 15,998
Stock price per share ......................................54.87 51.00
Sales....................................................... 16,047 14,072
Earnings before interest and taxes.................. 3,371 2,888
Required
a. Compute and compare the Altman Z-scores for both years. What explains the apparent trend?
b. Is the company more likely to go bankrupt given the Z-score in 2013 compared to 2012? Explain
4-31
Assess Credit Risk (LO2, 3)
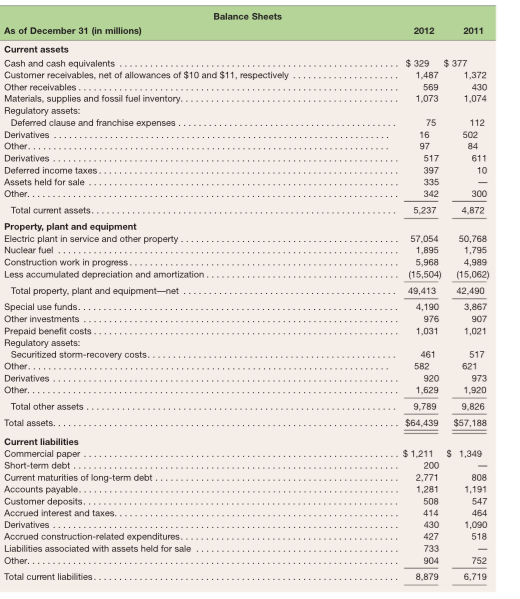
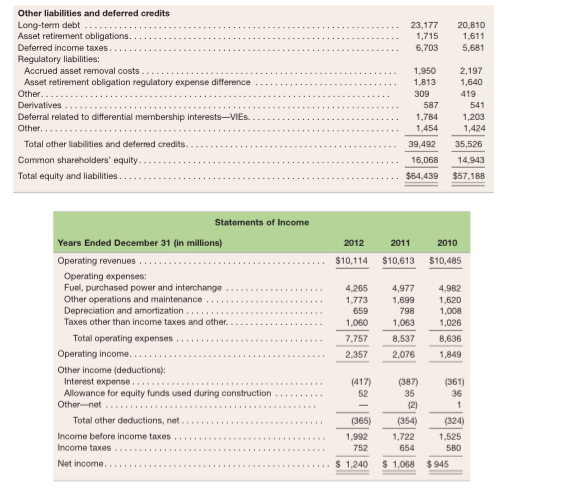
Balance sheets and income statements for NextEra Energy, Inc. follow. Refer to these financial state-ments to answer the requirements
Required
a. Use the financial statements and the information below to compute the following profitability and coverage, liquidity and solvency ratios for 2012 and 2011: RNOA, ROE, times interest earned, free cash flow to debt, current ratio, quick ratio, liabilities-to-equity ratio, and total debt-to-equity ratio. (For simplicity here, use year-end balances for the denominator of RNOA and ROE.) Comment on any observed trends

b. Summarize your findings in a conclusion about the companys credit risk. Do you have any concerns about the companys ability to meet its debt obligations?
*** Show ALL Work Please To Be Voted Best Answer ***
Balance Sheets As of December 31 (in millions) 2011 $329 $377 Customer receivables, net of allowances of $10 and $11, respectively Materials, supplies and fossil fuel inventory Regulatory assets: Deferred clause and franchise expenses Electric plant in service and other property Construction work in progres:s Less accurmulated depreciation and amortization... Current maturities of long-term debt taxes. Liabilities associated with assets held for sale 8.879
Step by Step Solution
There are 3 Steps involved in it

Get step-by-step solutions from verified subject matter experts