

Question: 4.35 The article Going Wireless (AARP Bulletin, June 2009) reported the estimated percentage of U.S. households with only wireless phone service (no landline) for the
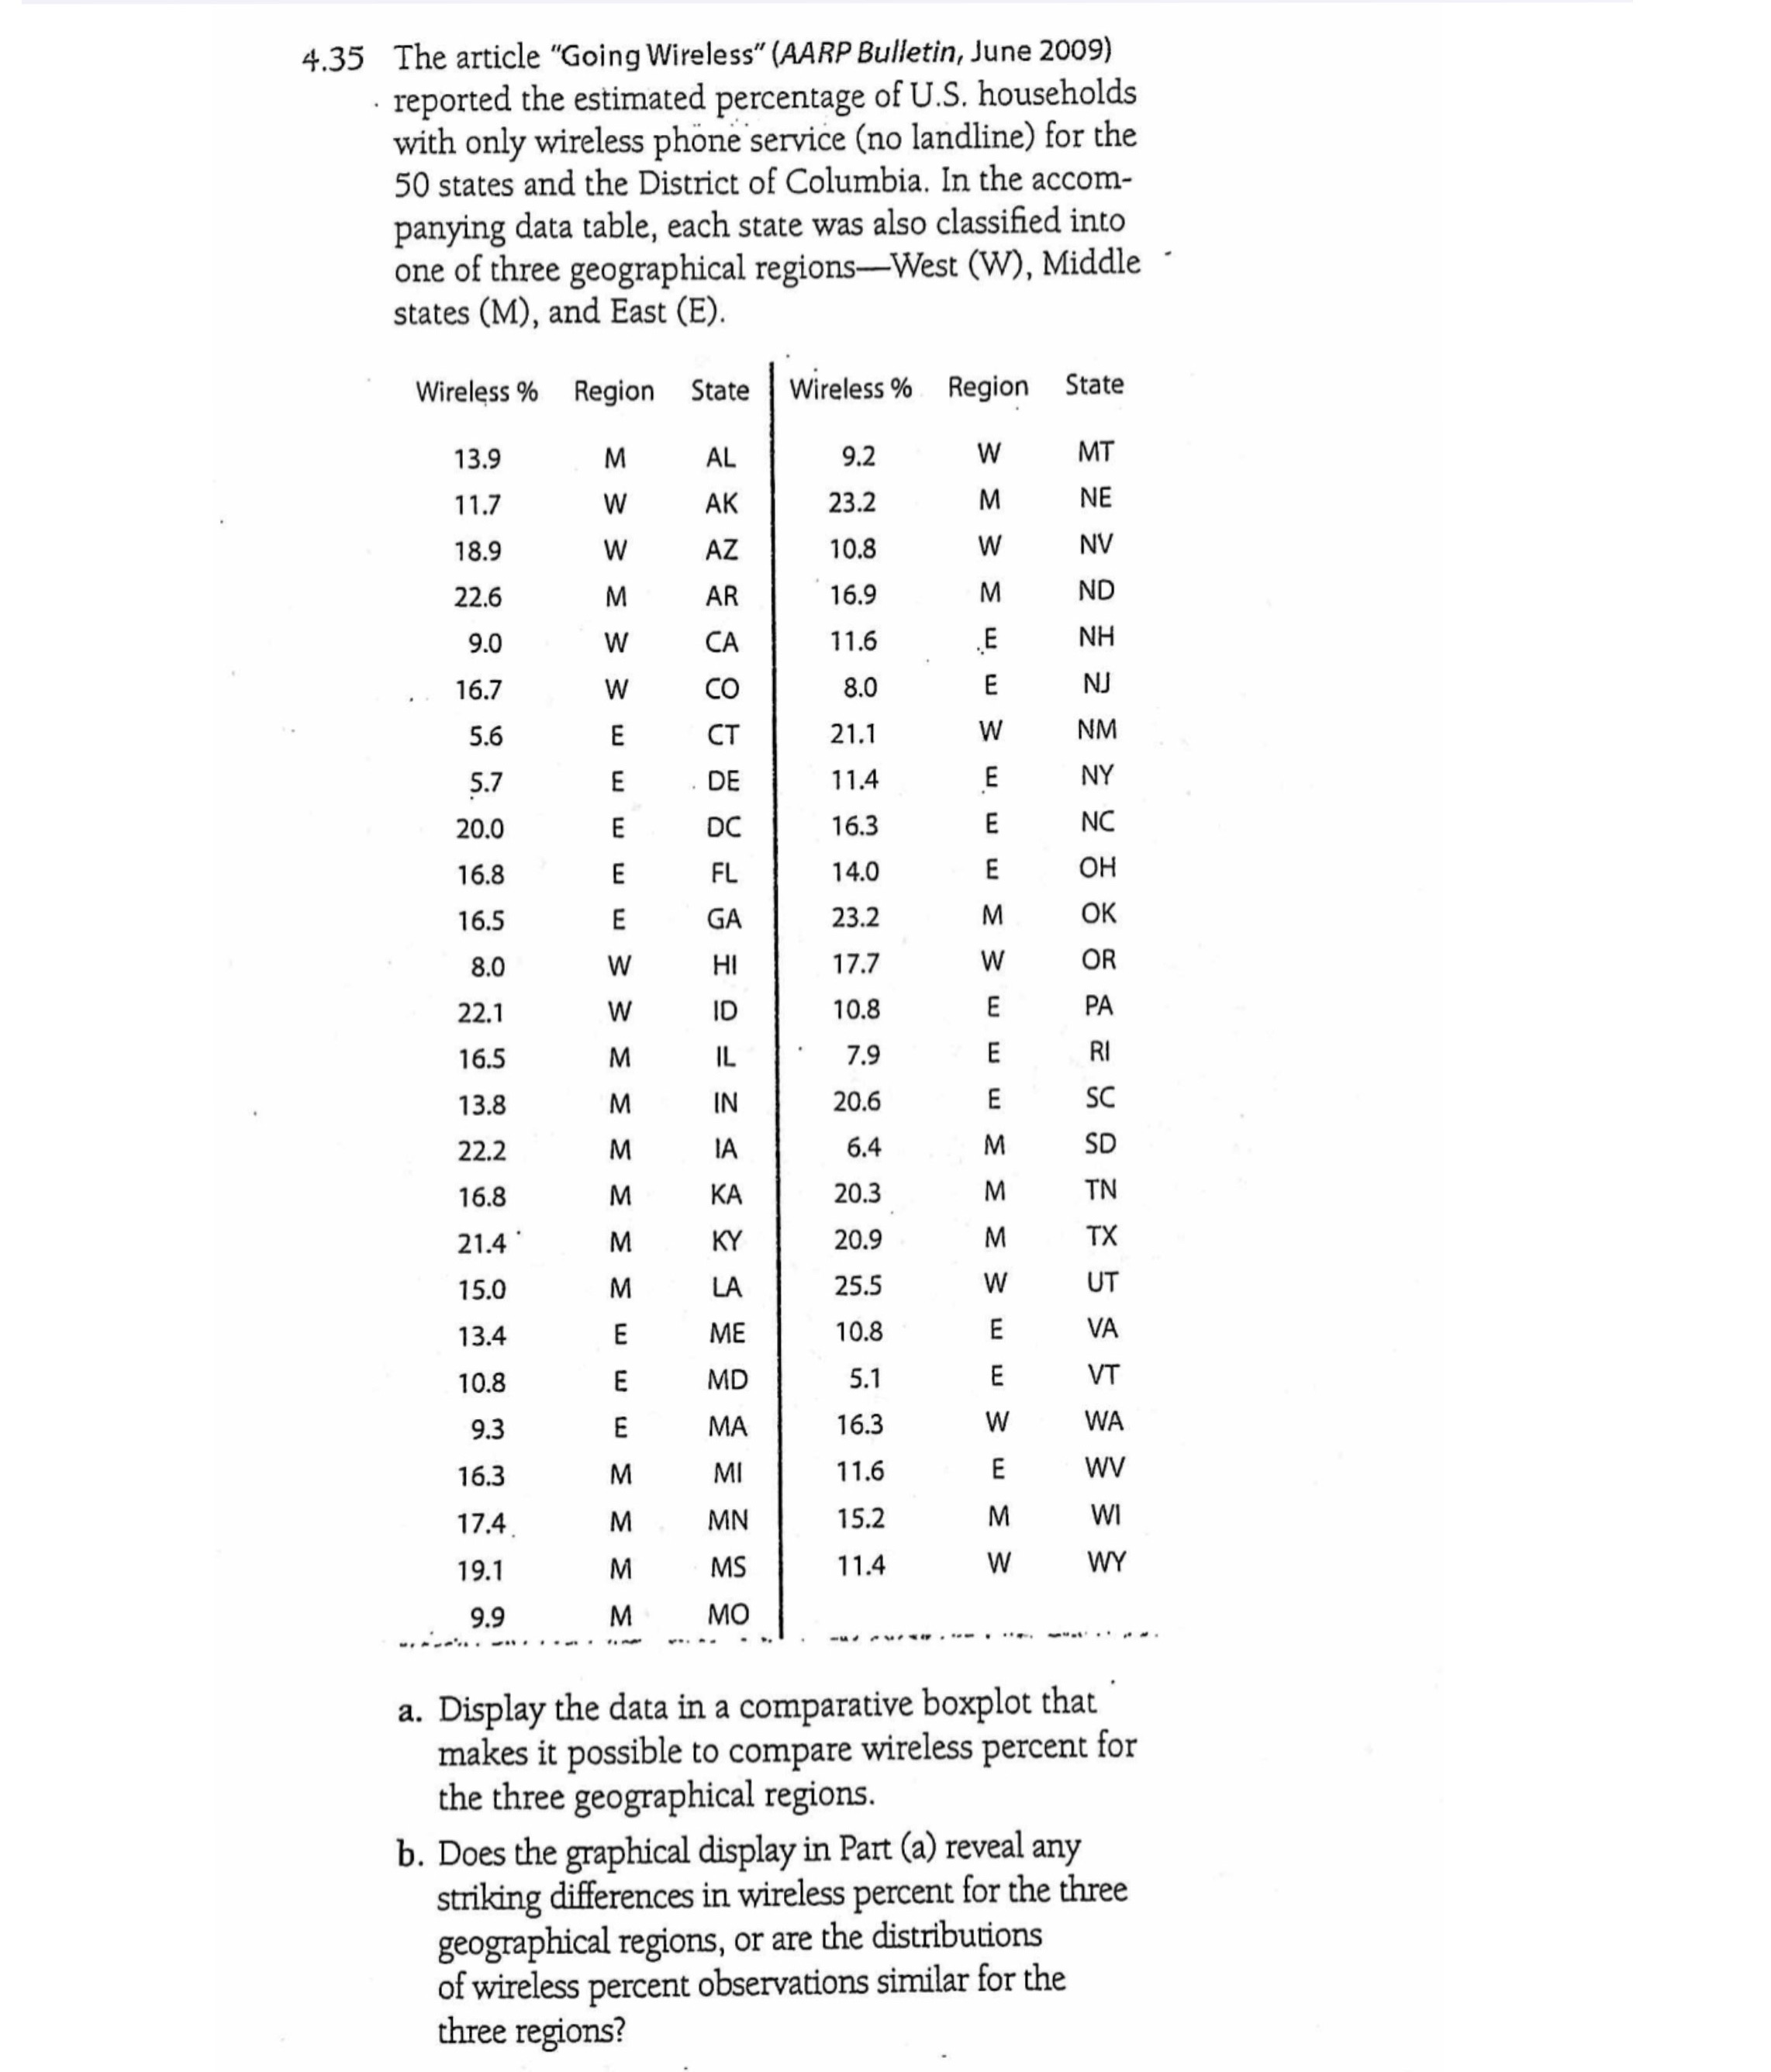
4.35 The article "Going Wireless" (AARP Bulletin, June 2009) reported the estimated percentage of U.S. households with only wireless phone service (no landline) for the 50 states and the District of Columbia. In the accom- panying data table, each state was also classified into one of three geographical regions-West (W), Middle states (M), and East (E). Wireless % Region State Wireless % Region State 13.9 M AL 9.2 MT 11.7 W AK 23.2 M NE NV 18.9 W AZ 10.8 W M 16.9 ND 22.6 AR M 9.0 W CA 11.6 NH 16.7 W CO 8.0 E NJ 5 .6 E CT 21.1 W NM E . DE 11.4 NY 5.7 m m 20.0 DC 16.3 NC 16.8 m mm FL 14.0 E OH 16.5 GA 23.2 M OK 8.0 W HI 17.7 W OR 22.1 W ID 10.8 PA m 16.5 M IL 7.9 E RI 13.8 M IN 20.6 m SC 22.2 M IA 6.4 M SD 16.8 M KA 20.3 M TN 21.4 M KY 20.9 M TX 15.0 M LA 25.5 W UT 13.4 ME 10. VA m m m m MD 5.1 VT 10.8 MA 16.3 W WA 9.3 m 16.3 M MI 11.6 WV 17.4 M MN 15.2 M WI 11.4 WY 19.1 M MS 9.9 M MO .. AP a. Display the data in a comparative boxplot that makes it possible to compare wireless percent for the three geographical regions. b. Does the graphical display in Part (a) reveal any striking differences in wireless percent for the three geographical regions, or are the distributions of wireless percent observations similar for the three regions
Step by Step Solution
There are 3 Steps involved in it

Get step-by-step solutions from verified subject matter experts