

Question: 4:38 AM Wed Oct 28 @ 93% Reader View Available + Spreadsheet Solutions The Blooper Spreadsheet Model : A Discounted cash-flow analysis of proposed capital
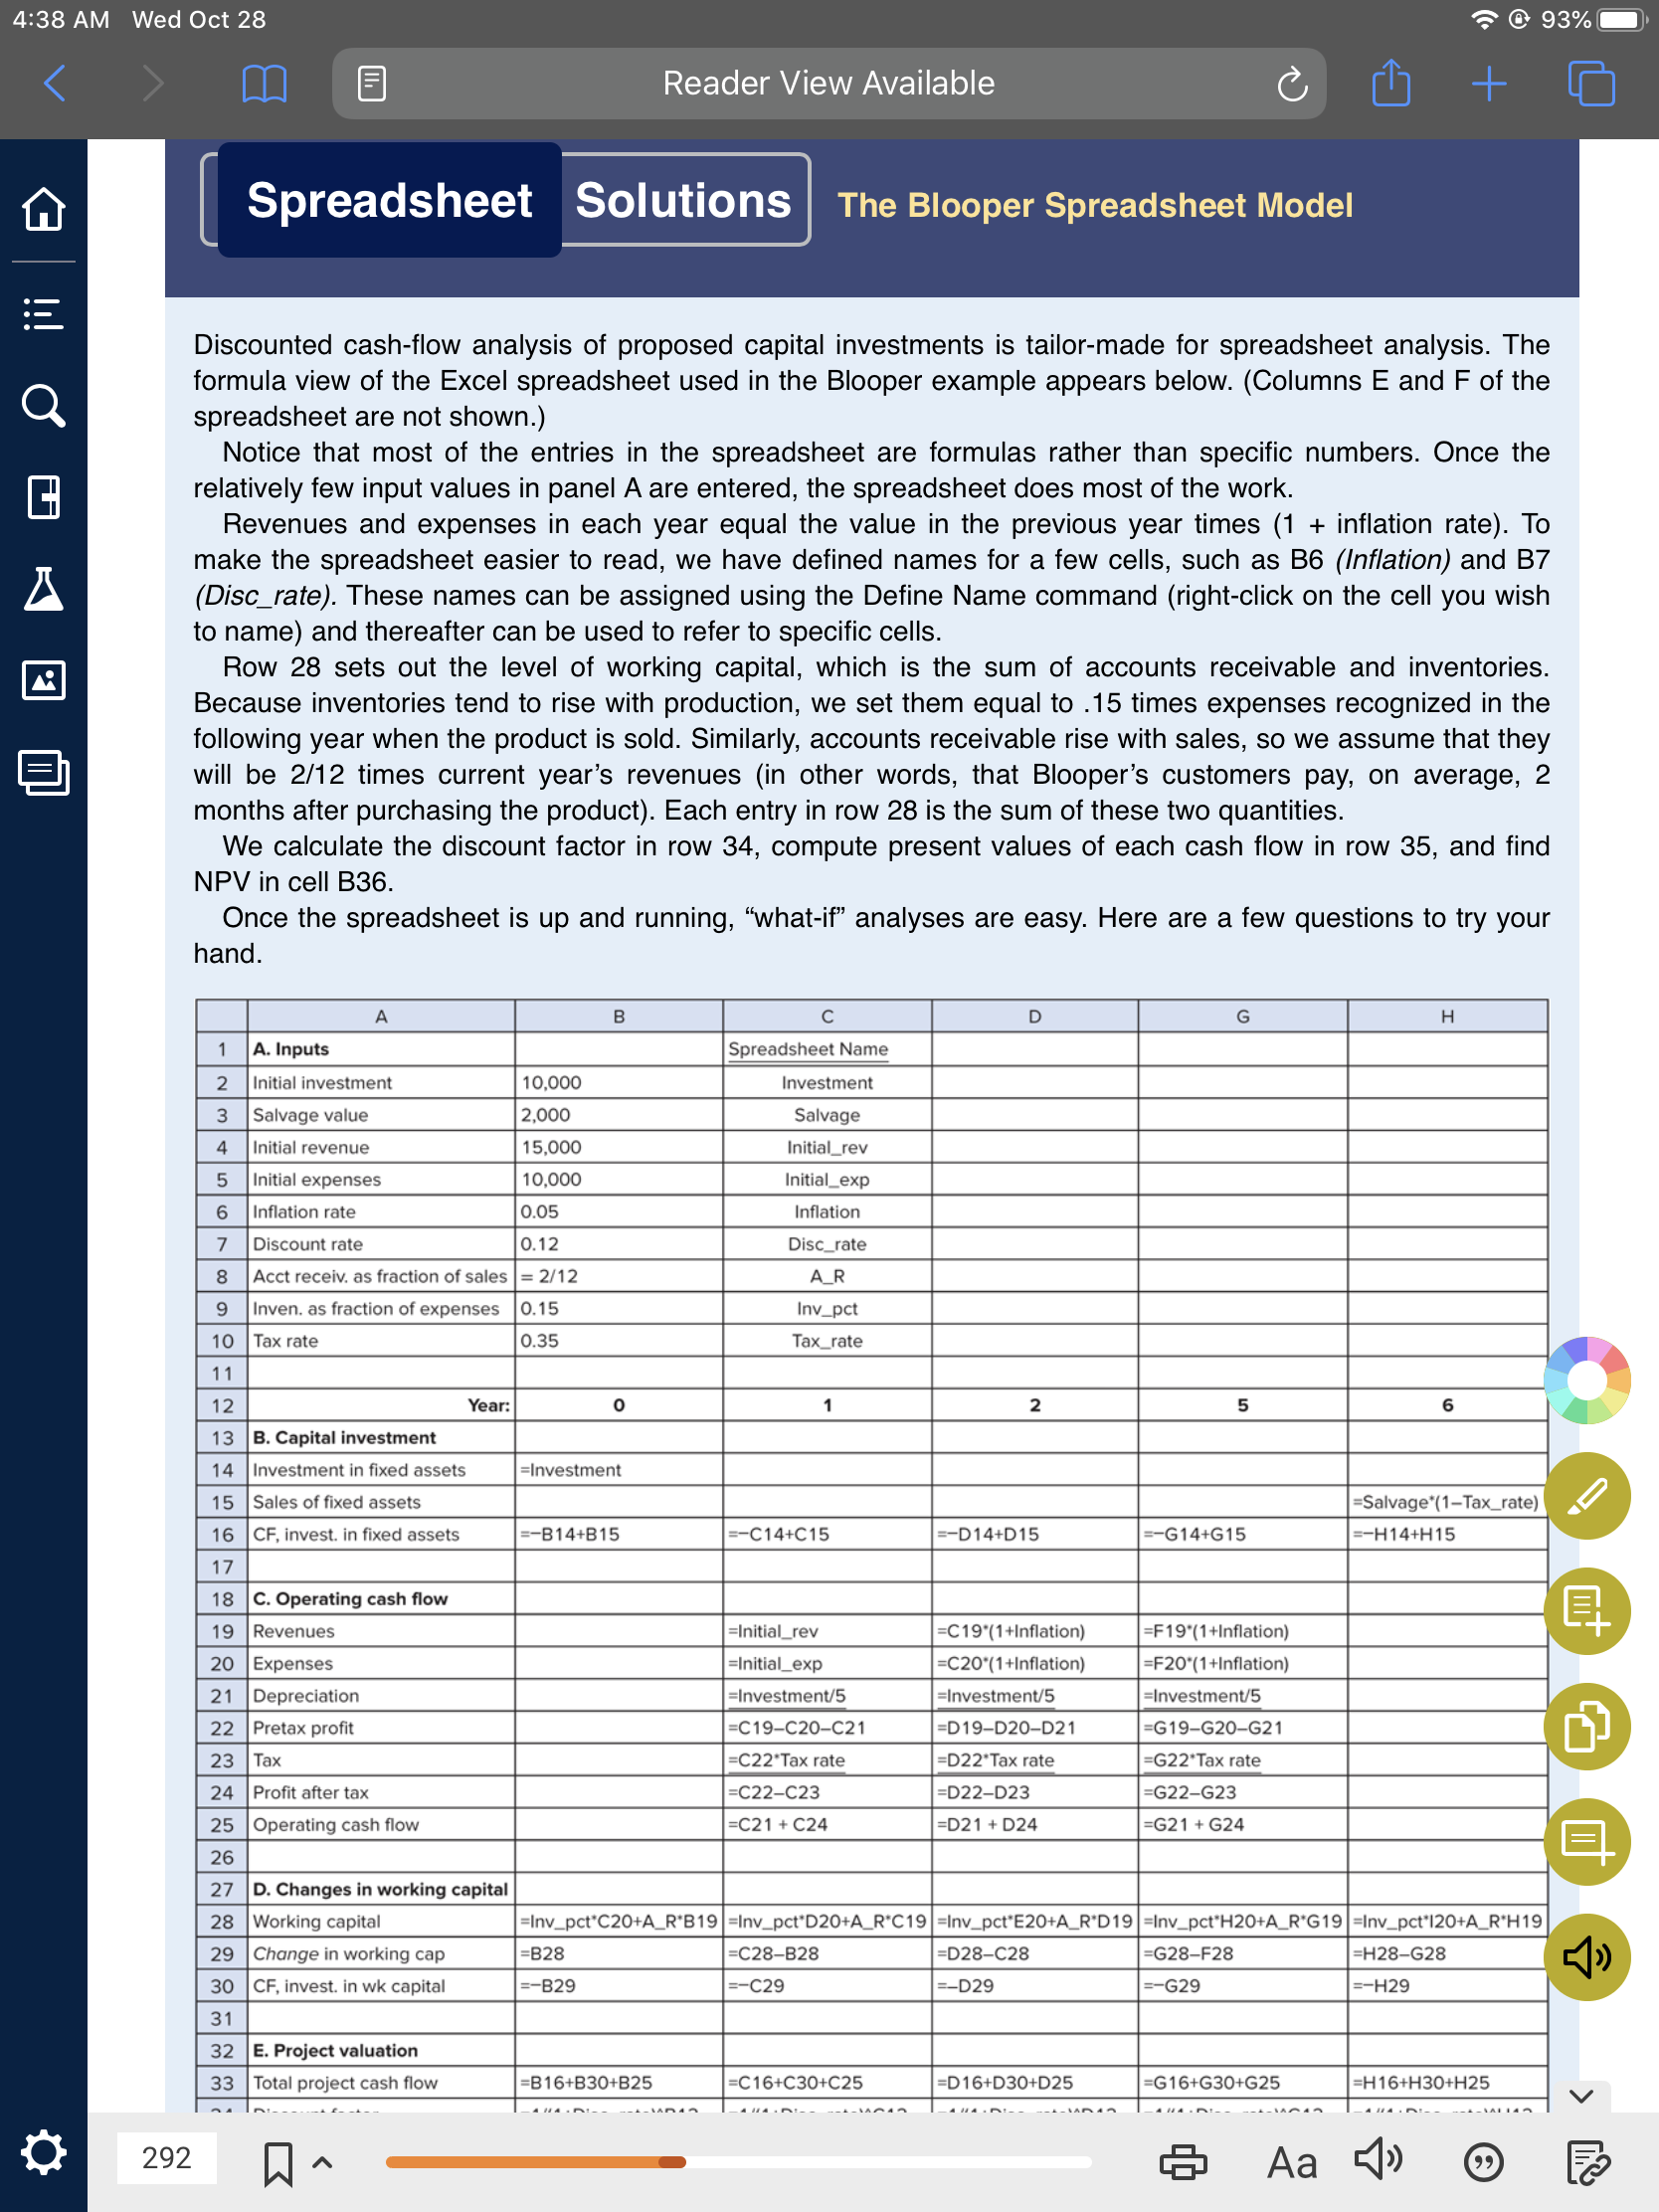
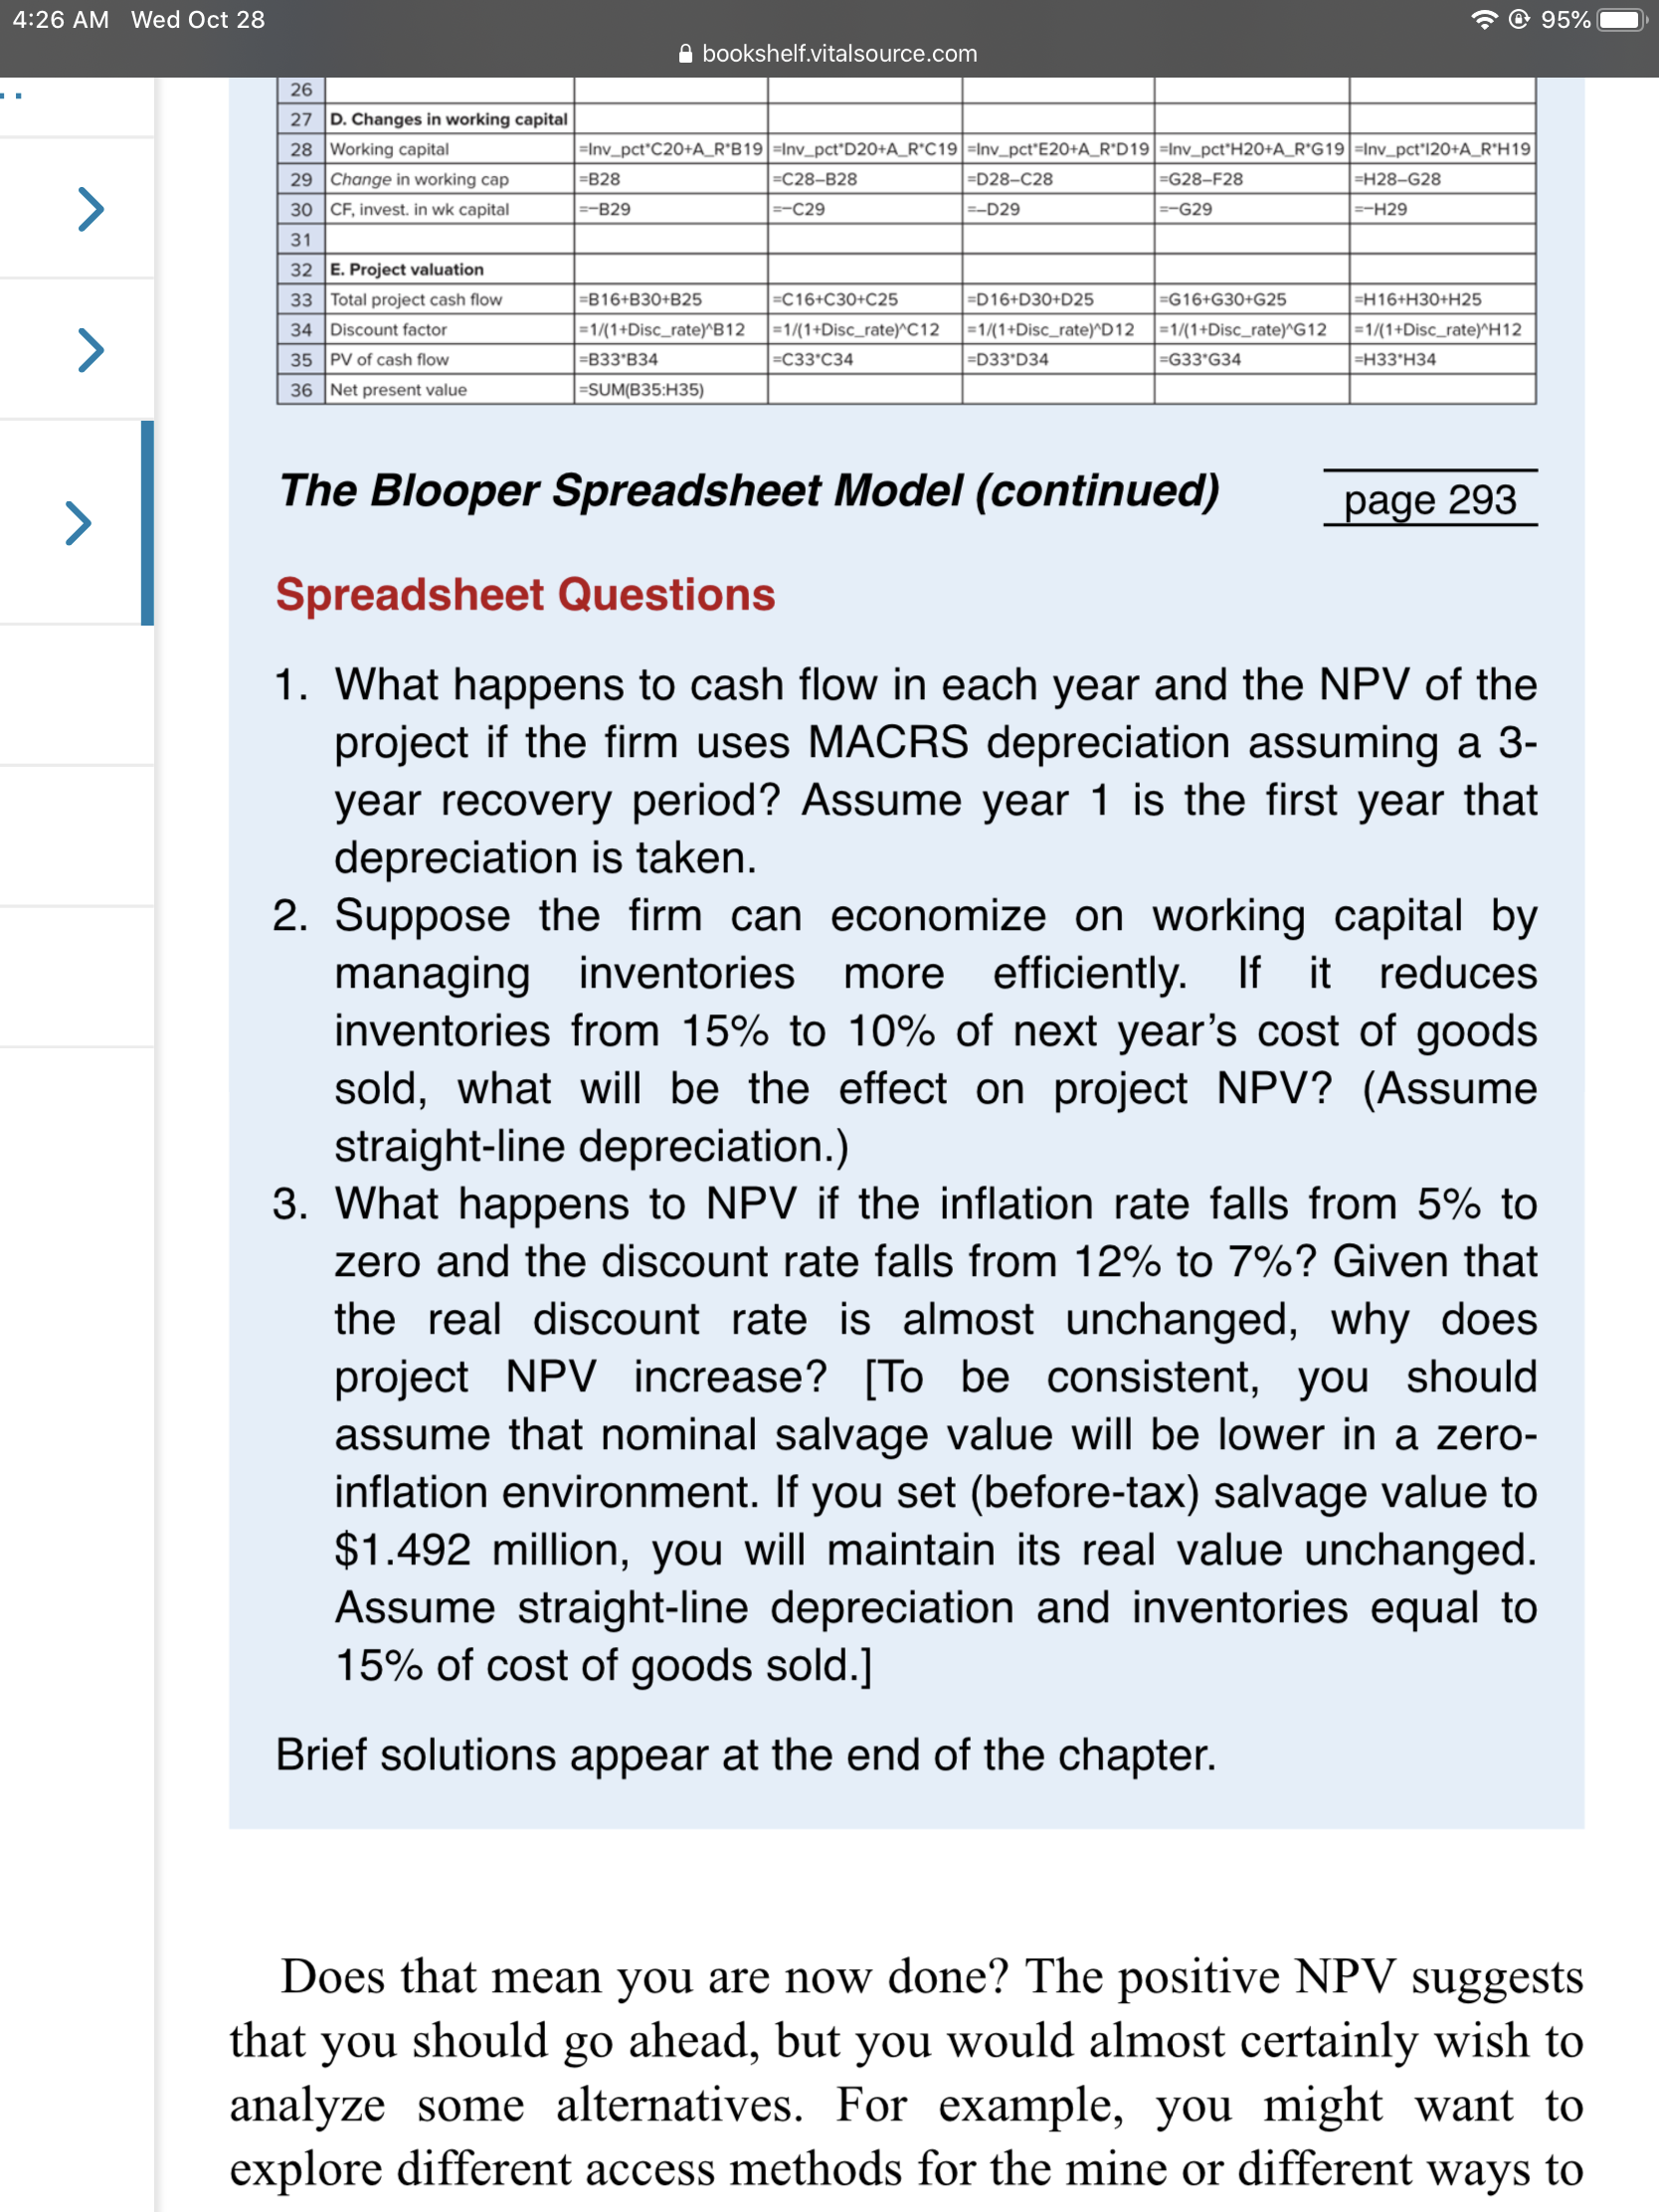
4:38 AM Wed Oct 28 @ 93% Reader View Available + Spreadsheet Solutions The Blooper Spreadsheet Model : A Discounted cash-flow analysis of proposed capital investments is tailor-made for spreadsheet analysis. The formula view of the Excel spreadsheet used in the Blooper example appears below. (Columns E and F of the spreadsheet are not shown.) Notice that most of the entries in the spreadsheet are formulas rather than specific numbers. Once the relatively few input values in panel A are entered, the spreadsheet does most of the work. Revenues and expenses in each year equal the value in the previous year times (1 + inflation rate). To make the spreadsheet easier to read, we have defined names for a few cells, such as B6 (Inflation) and B7 (Disc_rate). These names can be assigned using the Define Name command (right-click on the cell you wish to name) and thereafter can be used to refer to specific cells. Row 28 sets out the level of working capital, which is the sum of accounts receivable and inventories. Because inventories tend to rise with production, we set them equal to 15 times expenses recognized in the following year when the product is sold. Similarly, accounts receivable rise with sales, so we assume that they will be 2/12 times current year's revenues (in other words, that Blooper's customers pay, on average, 2 months after purchasing the product). Each entry in row 28 is the sum of these two quantities. We calculate the discount factor in row 34, compute present values of each cash flow in row 35, and find NPV in cell B36. Once the spreadsheet is up and running, what-if analyses are easy. Here are a few questions to try your hand. B D G H 1 A. Inputs Spreadsheet Name 2 Initial investment Investment 3 Salvage value Salvage 10,000 2,000 15,000 10,000 4 Initial revenue Initial_rev 5 Initial expenses Initial_exp 6 Inflation rate 0.05 Inflation Disc_rate AR 7 Discount rate 0.12 8 Acct receiv. as fraction of sales = 2/12 9 Inven. as fraction of expenses 0.15 10 Tax rate 0.35 11 Inv_pct Tax_rate o 1 2 5 6 12 Year: 13 B. Capital investment 14 Investment in fixed assets =Investment =Salvage*(1-Tax_rate) =-H14+H15 =-B14+B15 E-C14+C15 =-D14+D 15 =-G14+G15 15 Sales of fixed assets 16 CF, invest. in fixed assets 17 18 C. Operating cash flow 19 Revenues =Initial_rev 20 Expenses 21 Depreciation 22 Pretax profit =Initial_exp =Investment/5 =C19-C20-C21 C22'Tax rate =C22-C23 =C19*(1 +Inflation) =C20"(1 +Inflation) =Investment/5 =D19-D20-021 =D22 Tax rate =F19' (1+Inflation) =F20*(1 +Inflation) =Investment/5 =G19-G20-G21 =G22*Tax rate 23 Tax 24 Profit after tax =G22-G23 =D22-D23 =D21 + D24 25 Operating cash flow =C21 + C24 =G21 + G24 26 27 D. Changes in working capital 28 Working capital 29 Change in working cap 30 CF, invest in wk capital 31 =Inv_pct*C20+A_R*B19 =Inv_pct*D20+A_R*C19 =Inv_pct*E20+A_R*D19 =Inv_pct*H20+A_R*G19 =Inv_pct*120+A_R*H19 =B28 =C28-B28 =D28-C28 =G28-F28 =H28-G28 =-B29 =-C29 =-D29 =-629 --H29 32 E. Project valuation 33 Total project cash flow =B16+B30+B25 =C16+C30+C25 =D16+D30+D25 =G16+G30+G25 =H16+H30+H25 292 A Aa 4:26 AM Wed Oct 28 @ 95% A bookshelf.vitalsource.com 26 > 27 D. Changes in working capital 28 Working capital =Inv_pct*C20+A_R'B19 =Inv_pctD20+A_R'C19 =Inv_pct'E20+A_R*D19 =Inv_pct'H20+A_R'G19 =Inv_pct'120+A_RH19 29 Change in working cap =B28 =C28-B28 =D28-C28 =G28-F28 =H28-G28 30 CF, invest. in wk capital --B29 =-C29 --D29 =-629 =-H29 31 32 E. Project valuation 33 Total project cash flow =B16+B30+B25 =C16+C30+C25 =D16+D30+D25 =G16+G30+G25 =H16+H30+H25 34 Discount factor =1/(1+Disc_rate) B12 =1/(1+Disc_rate) C12 =1/(1+Disc_rate) D12 =1/(1+Disc_rate)"G12 =1/(1+Disc_rate) H12 35 PV of cash flow =B33B34 =C33'034 D33 D34 =G33'G34 =H33 H34 36 Net present value =SUM(B35:H35) > The Blooper Spreadsheet Model (continued) > page 293 Spreadsheet Questions 1. What happens to cash flow in each year and the NPV of the project if the firm uses MACRS depreciation assuming a 3- year recovery period? Assume year 1 is the first year that depreciation is taken. 2. Suppose the firm can economize on working capital by managing inventories more efficiently. If it reduces inventories from 15% to 10% of next year's cost of goods sold, what will be the effect on project NPV? (Assume straight-line depreciation.) 3. What happens to NPV if the inflation rate falls from 5% to zero and the discount rate falls from 12% to 7%? Given that the real discount rate is almost unchanged, why does project NPV increase? [To be consistent, you should assume that nominal salvage value will be lower in a zero- inflation environment. If you set (before-tax) salvage value to $1.492 million, you will maintain its real value unchanged. Assume straight-line depreciation and inventories equal to 15% of cost of goods sold.] Brief solutions appear at the end of the chapter. Does that mean you are now done? The positive NPV suggests that you should go ahead, but you would almost certainly wish to analyze some alternatives. For example, you might want to explore different access methods for the mine or different ways to 4:38 AM Wed Oct 28 @ 93% Reader View Available + Spreadsheet Solutions The Blooper Spreadsheet Model : A Discounted cash-flow analysis of proposed capital investments is tailor-made for spreadsheet analysis. The formula view of the Excel spreadsheet used in the Blooper example appears below. (Columns E and F of the spreadsheet are not shown.) Notice that most of the entries in the spreadsheet are formulas rather than specific numbers. Once the relatively few input values in panel A are entered, the spreadsheet does most of the work. Revenues and expenses in each year equal the value in the previous year times (1 + inflation rate). To make the spreadsheet easier to read, we have defined names for a few cells, such as B6 (Inflation) and B7 (Disc_rate). These names can be assigned using the Define Name command (right-click on the cell you wish to name) and thereafter can be used to refer to specific cells. Row 28 sets out the level of working capital, which is the sum of accounts receivable and inventories. Because inventories tend to rise with production, we set them equal to 15 times expenses recognized in the following year when the product is sold. Similarly, accounts receivable rise with sales, so we assume that they will be 2/12 times current year's revenues (in other words, that Blooper's customers pay, on average, 2 months after purchasing the product). Each entry in row 28 is the sum of these two quantities. We calculate the discount factor in row 34, compute present values of each cash flow in row 35, and find NPV in cell B36. Once the spreadsheet is up and running, what-if analyses are easy. Here are a few questions to try your hand. B D G H 1 A. Inputs Spreadsheet Name 2 Initial investment Investment 3 Salvage value Salvage 10,000 2,000 15,000 10,000 4 Initial revenue Initial_rev 5 Initial expenses Initial_exp 6 Inflation rate 0.05 Inflation Disc_rate AR 7 Discount rate 0.12 8 Acct receiv. as fraction of sales = 2/12 9 Inven. as fraction of expenses 0.15 10 Tax rate 0.35 11 Inv_pct Tax_rate o 1 2 5 6 12 Year: 13 B. Capital investment 14 Investment in fixed assets =Investment =Salvage*(1-Tax_rate) =-H14+H15 =-B14+B15 E-C14+C15 =-D14+D 15 =-G14+G15 15 Sales of fixed assets 16 CF, invest. in fixed assets 17 18 C. Operating cash flow 19 Revenues =Initial_rev 20 Expenses 21 Depreciation 22 Pretax profit =Initial_exp =Investment/5 =C19-C20-C21 C22'Tax rate =C22-C23 =C19*(1 +Inflation) =C20"(1 +Inflation) =Investment/5 =D19-D20-021 =D22 Tax rate =F19' (1+Inflation) =F20*(1 +Inflation) =Investment/5 =G19-G20-G21 =G22*Tax rate 23 Tax 24 Profit after tax =G22-G23 =D22-D23 =D21 + D24 25 Operating cash flow =C21 + C24 =G21 + G24 26 27 D. Changes in working capital 28 Working capital 29 Change in working cap 30 CF, invest in wk capital 31 =Inv_pct*C20+A_R*B19 =Inv_pct*D20+A_R*C19 =Inv_pct*E20+A_R*D19 =Inv_pct*H20+A_R*G19 =Inv_pct*120+A_R*H19 =B28 =C28-B28 =D28-C28 =G28-F28 =H28-G28 =-B29 =-C29 =-D29 =-629 --H29 32 E. Project valuation 33 Total project cash flow =B16+B30+B25 =C16+C30+C25 =D16+D30+D25 =G16+G30+G25 =H16+H30+H25 292 A Aa 4:26 AM Wed Oct 28 @ 95% A bookshelf.vitalsource.com 26 > 27 D. Changes in working capital 28 Working capital =Inv_pct*C20+A_R'B19 =Inv_pctD20+A_R'C19 =Inv_pct'E20+A_R*D19 =Inv_pct'H20+A_R'G19 =Inv_pct'120+A_RH19 29 Change in working cap =B28 =C28-B28 =D28-C28 =G28-F28 =H28-G28 30 CF, invest. in wk capital --B29 =-C29 --D29 =-629 =-H29 31 32 E. Project valuation 33 Total project cash flow =B16+B30+B25 =C16+C30+C25 =D16+D30+D25 =G16+G30+G25 =H16+H30+H25 34 Discount factor =1/(1+Disc_rate) B12 =1/(1+Disc_rate) C12 =1/(1+Disc_rate) D12 =1/(1+Disc_rate)"G12 =1/(1+Disc_rate) H12 35 PV of cash flow =B33B34 =C33'034 D33 D34 =G33'G34 =H33 H34 36 Net present value =SUM(B35:H35) > The Blooper Spreadsheet Model (continued) > page 293 Spreadsheet Questions 1. What happens to cash flow in each year and the NPV of the project if the firm uses MACRS depreciation assuming a 3- year recovery period? Assume year 1 is the first year that depreciation is taken. 2. Suppose the firm can economize on working capital by managing inventories more efficiently. If it reduces inventories from 15% to 10% of next year's cost of goods sold, what will be the effect on project NPV? (Assume straight-line depreciation.) 3. What happens to NPV if the inflation rate falls from 5% to zero and the discount rate falls from 12% to 7%? Given that the real discount rate is almost unchanged, why does project NPV increase? [To be consistent, you should assume that nominal salvage value will be lower in a zero- inflation environment. If you set (before-tax) salvage value to $1.492 million, you will maintain its real value unchanged. Assume straight-line depreciation and inventories equal to 15% of cost of goods sold.] Brief solutions appear at the end of the chapter. Does that mean you are now done? The positive NPV suggests that you should go ahead, but you would almost certainly wish to analyze some alternatives. For example, you might want to explore different access methods for the mine or different ways to
Step by Step Solution
There are 3 Steps involved in it

Get step-by-step solutions from verified subject matter experts