

Question: 4:58 PM Mon Feb 28 12% myopenmath.com 2.4 Five Number Summary 1hr57mins X Find the Five Number Summary 15 4 9 8 18 6 27
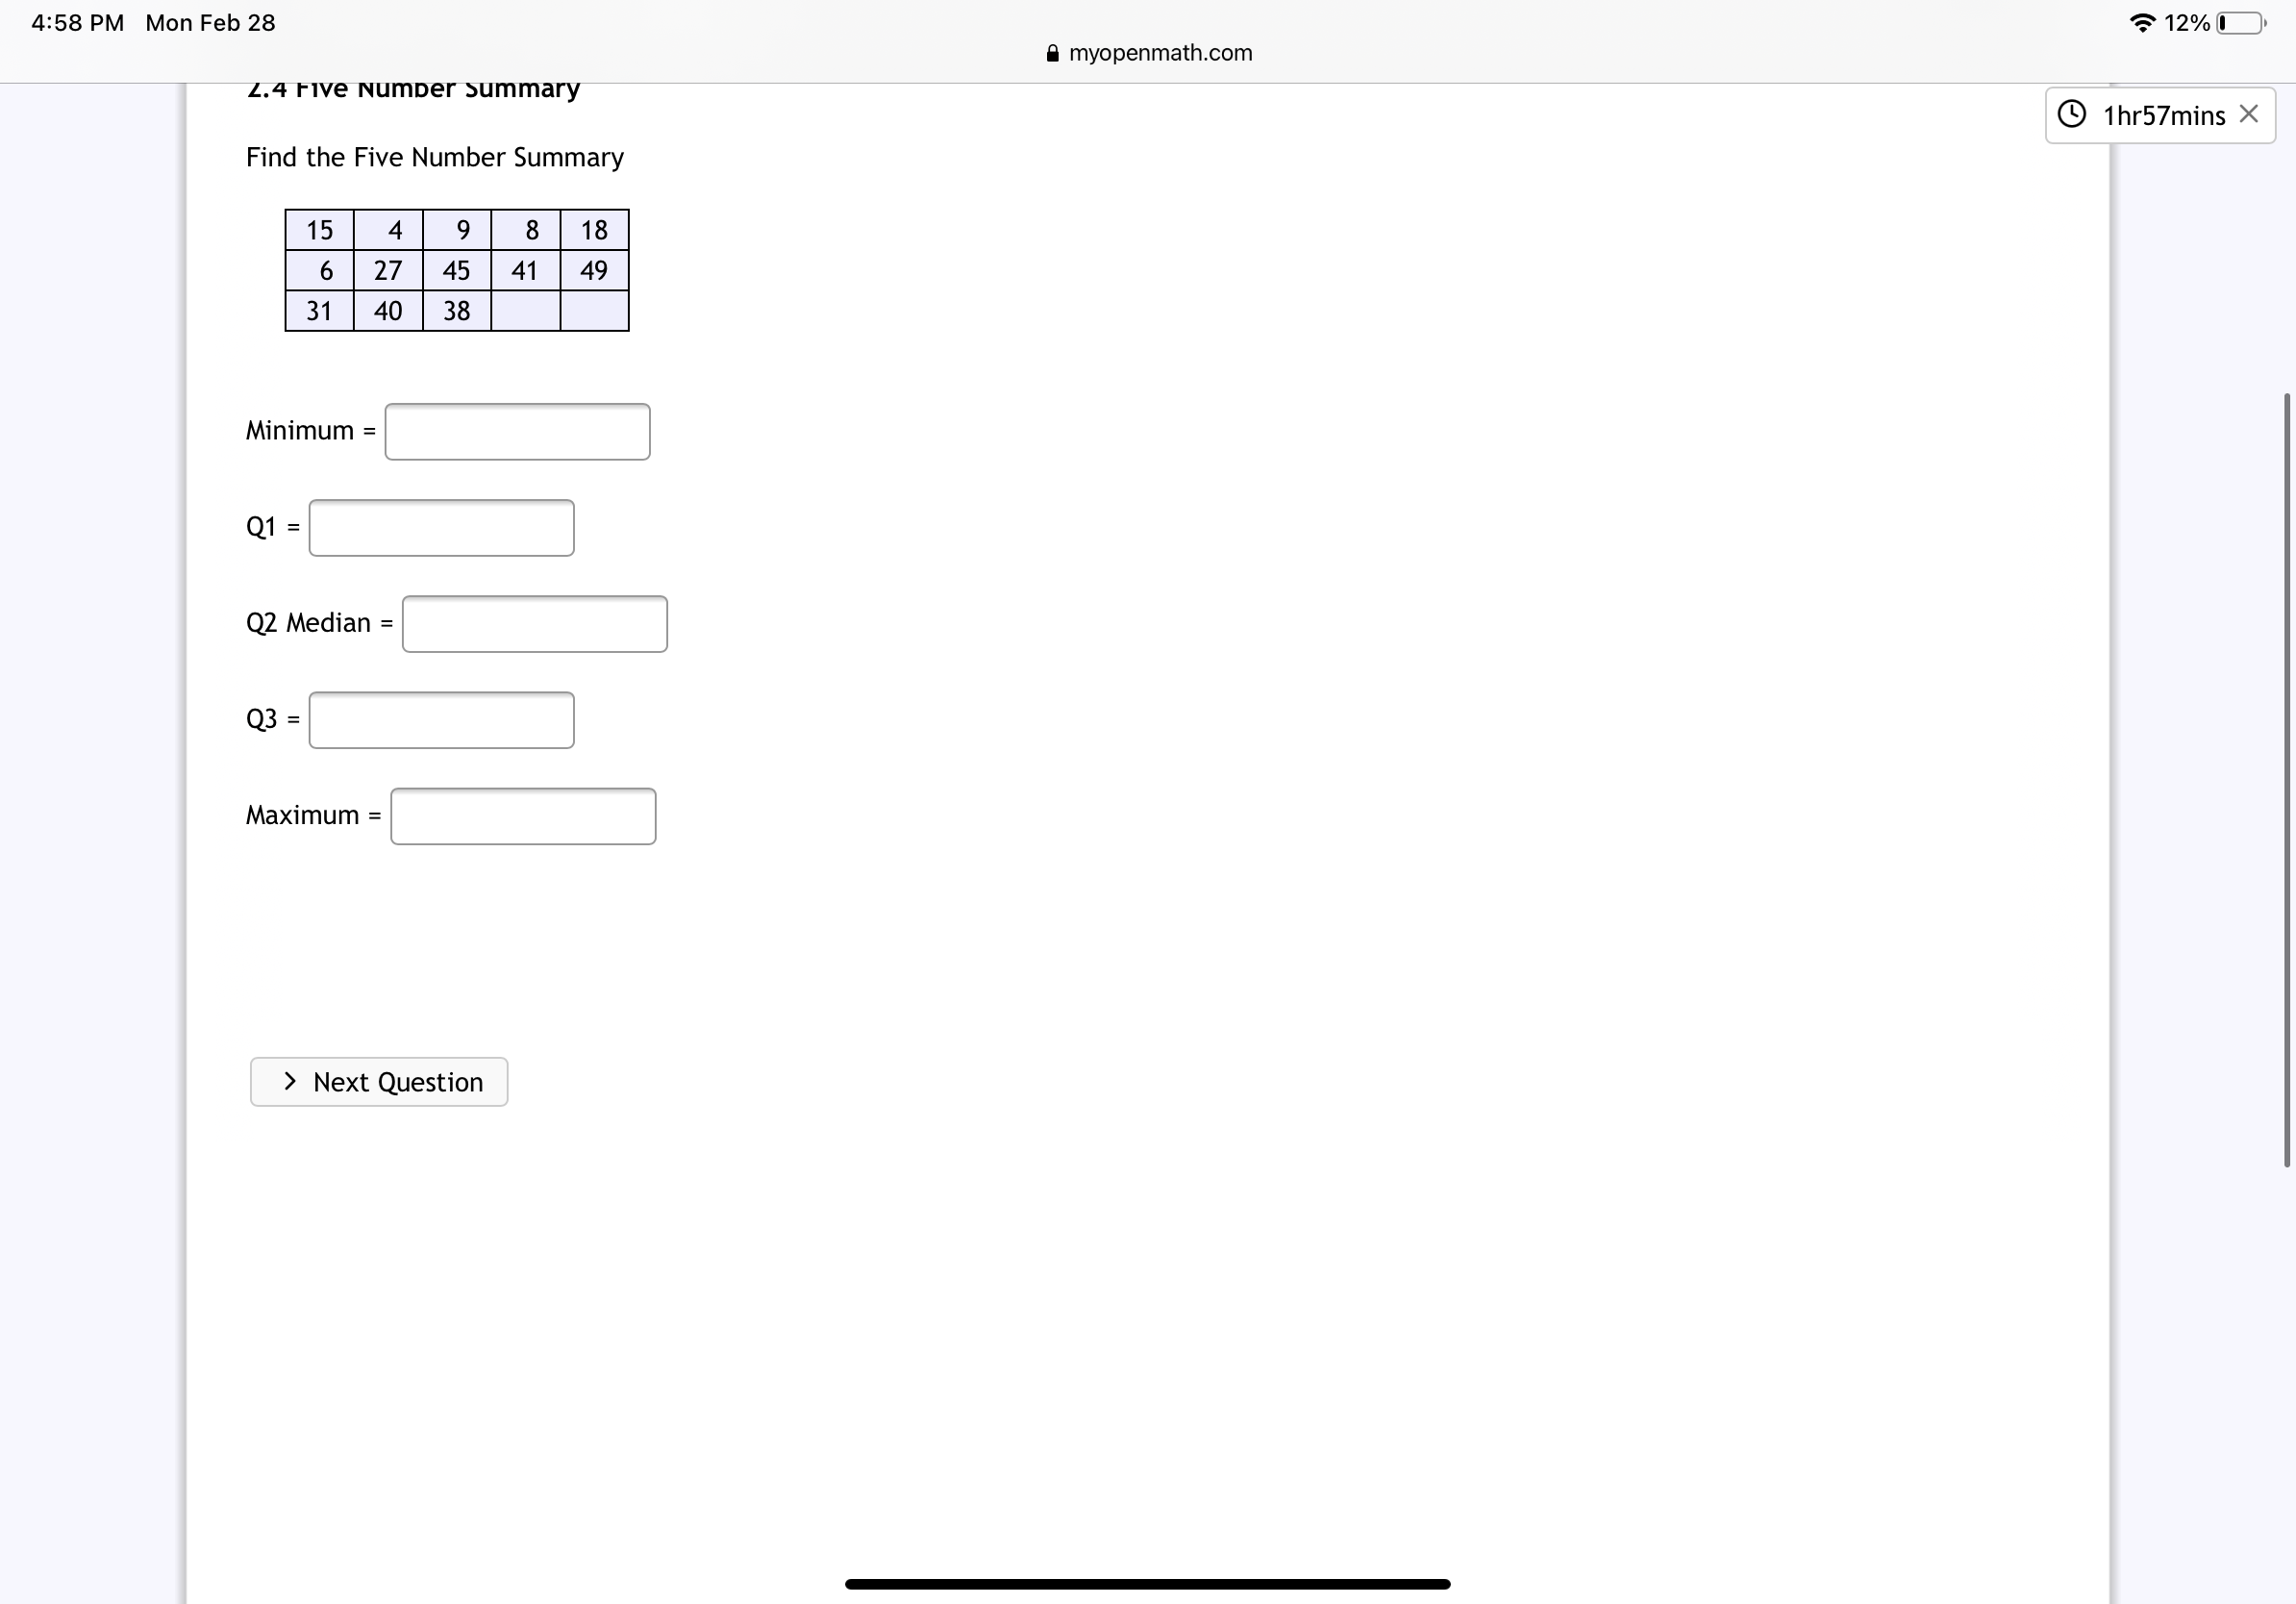
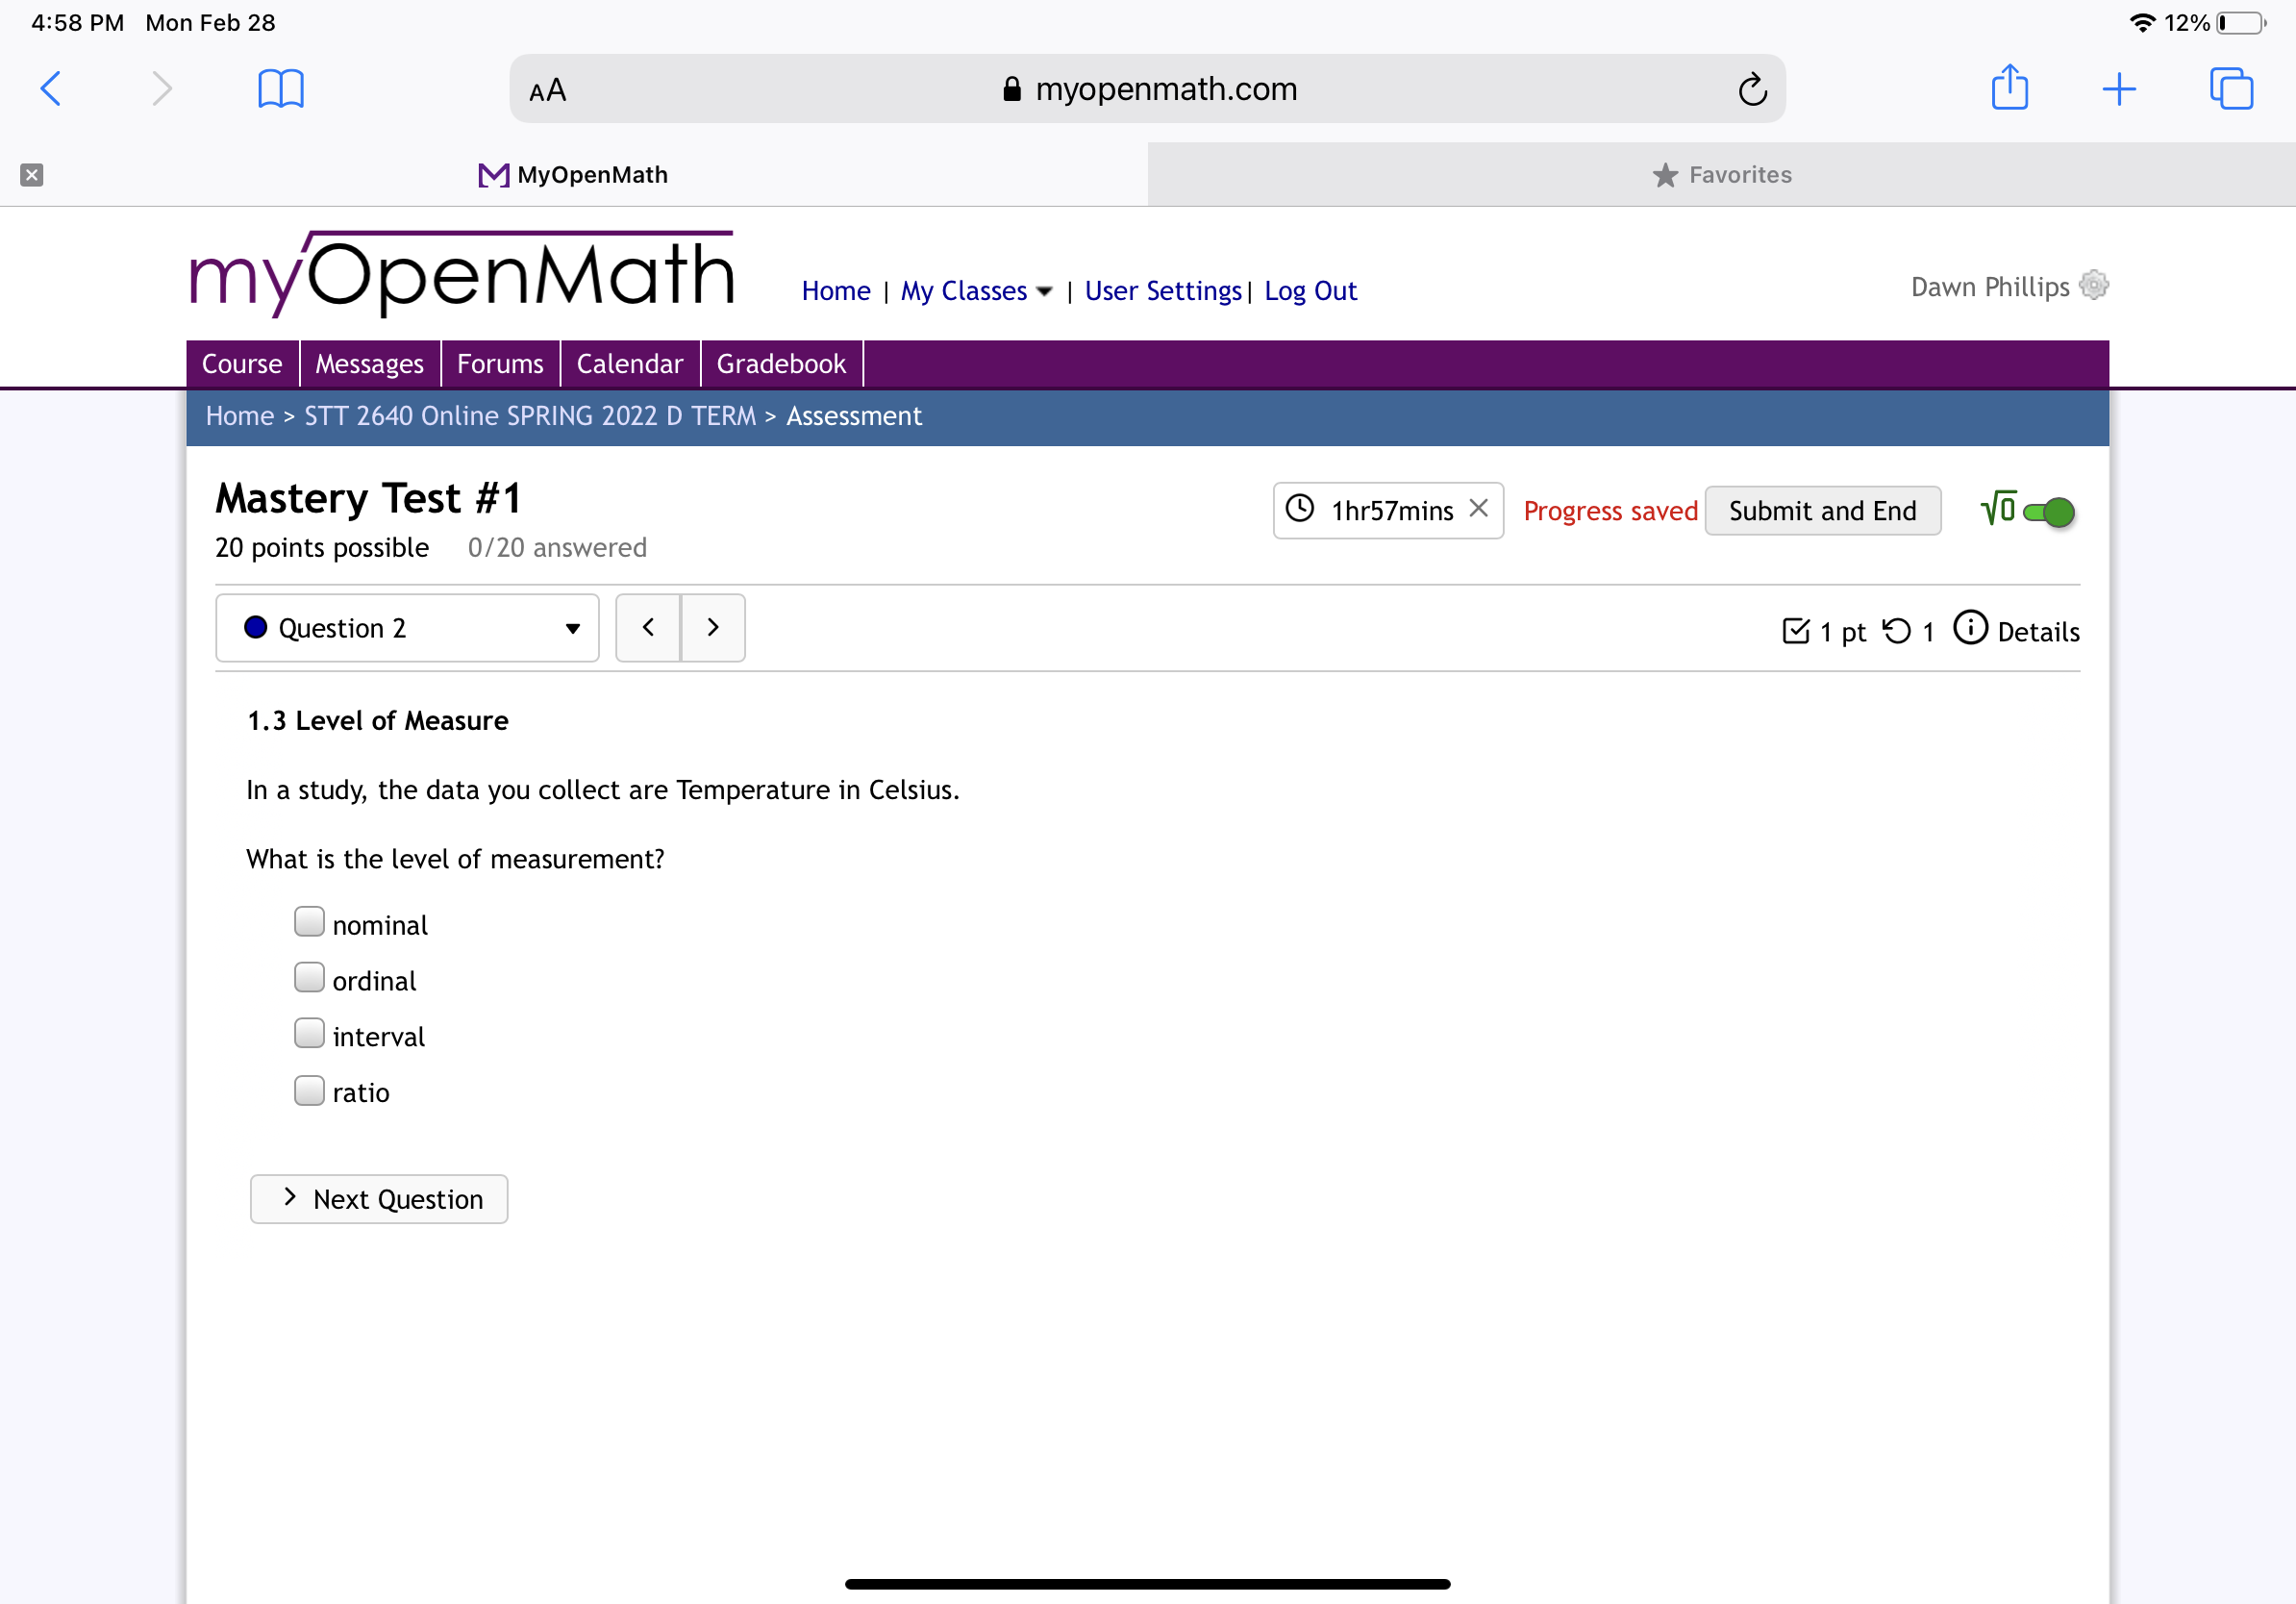
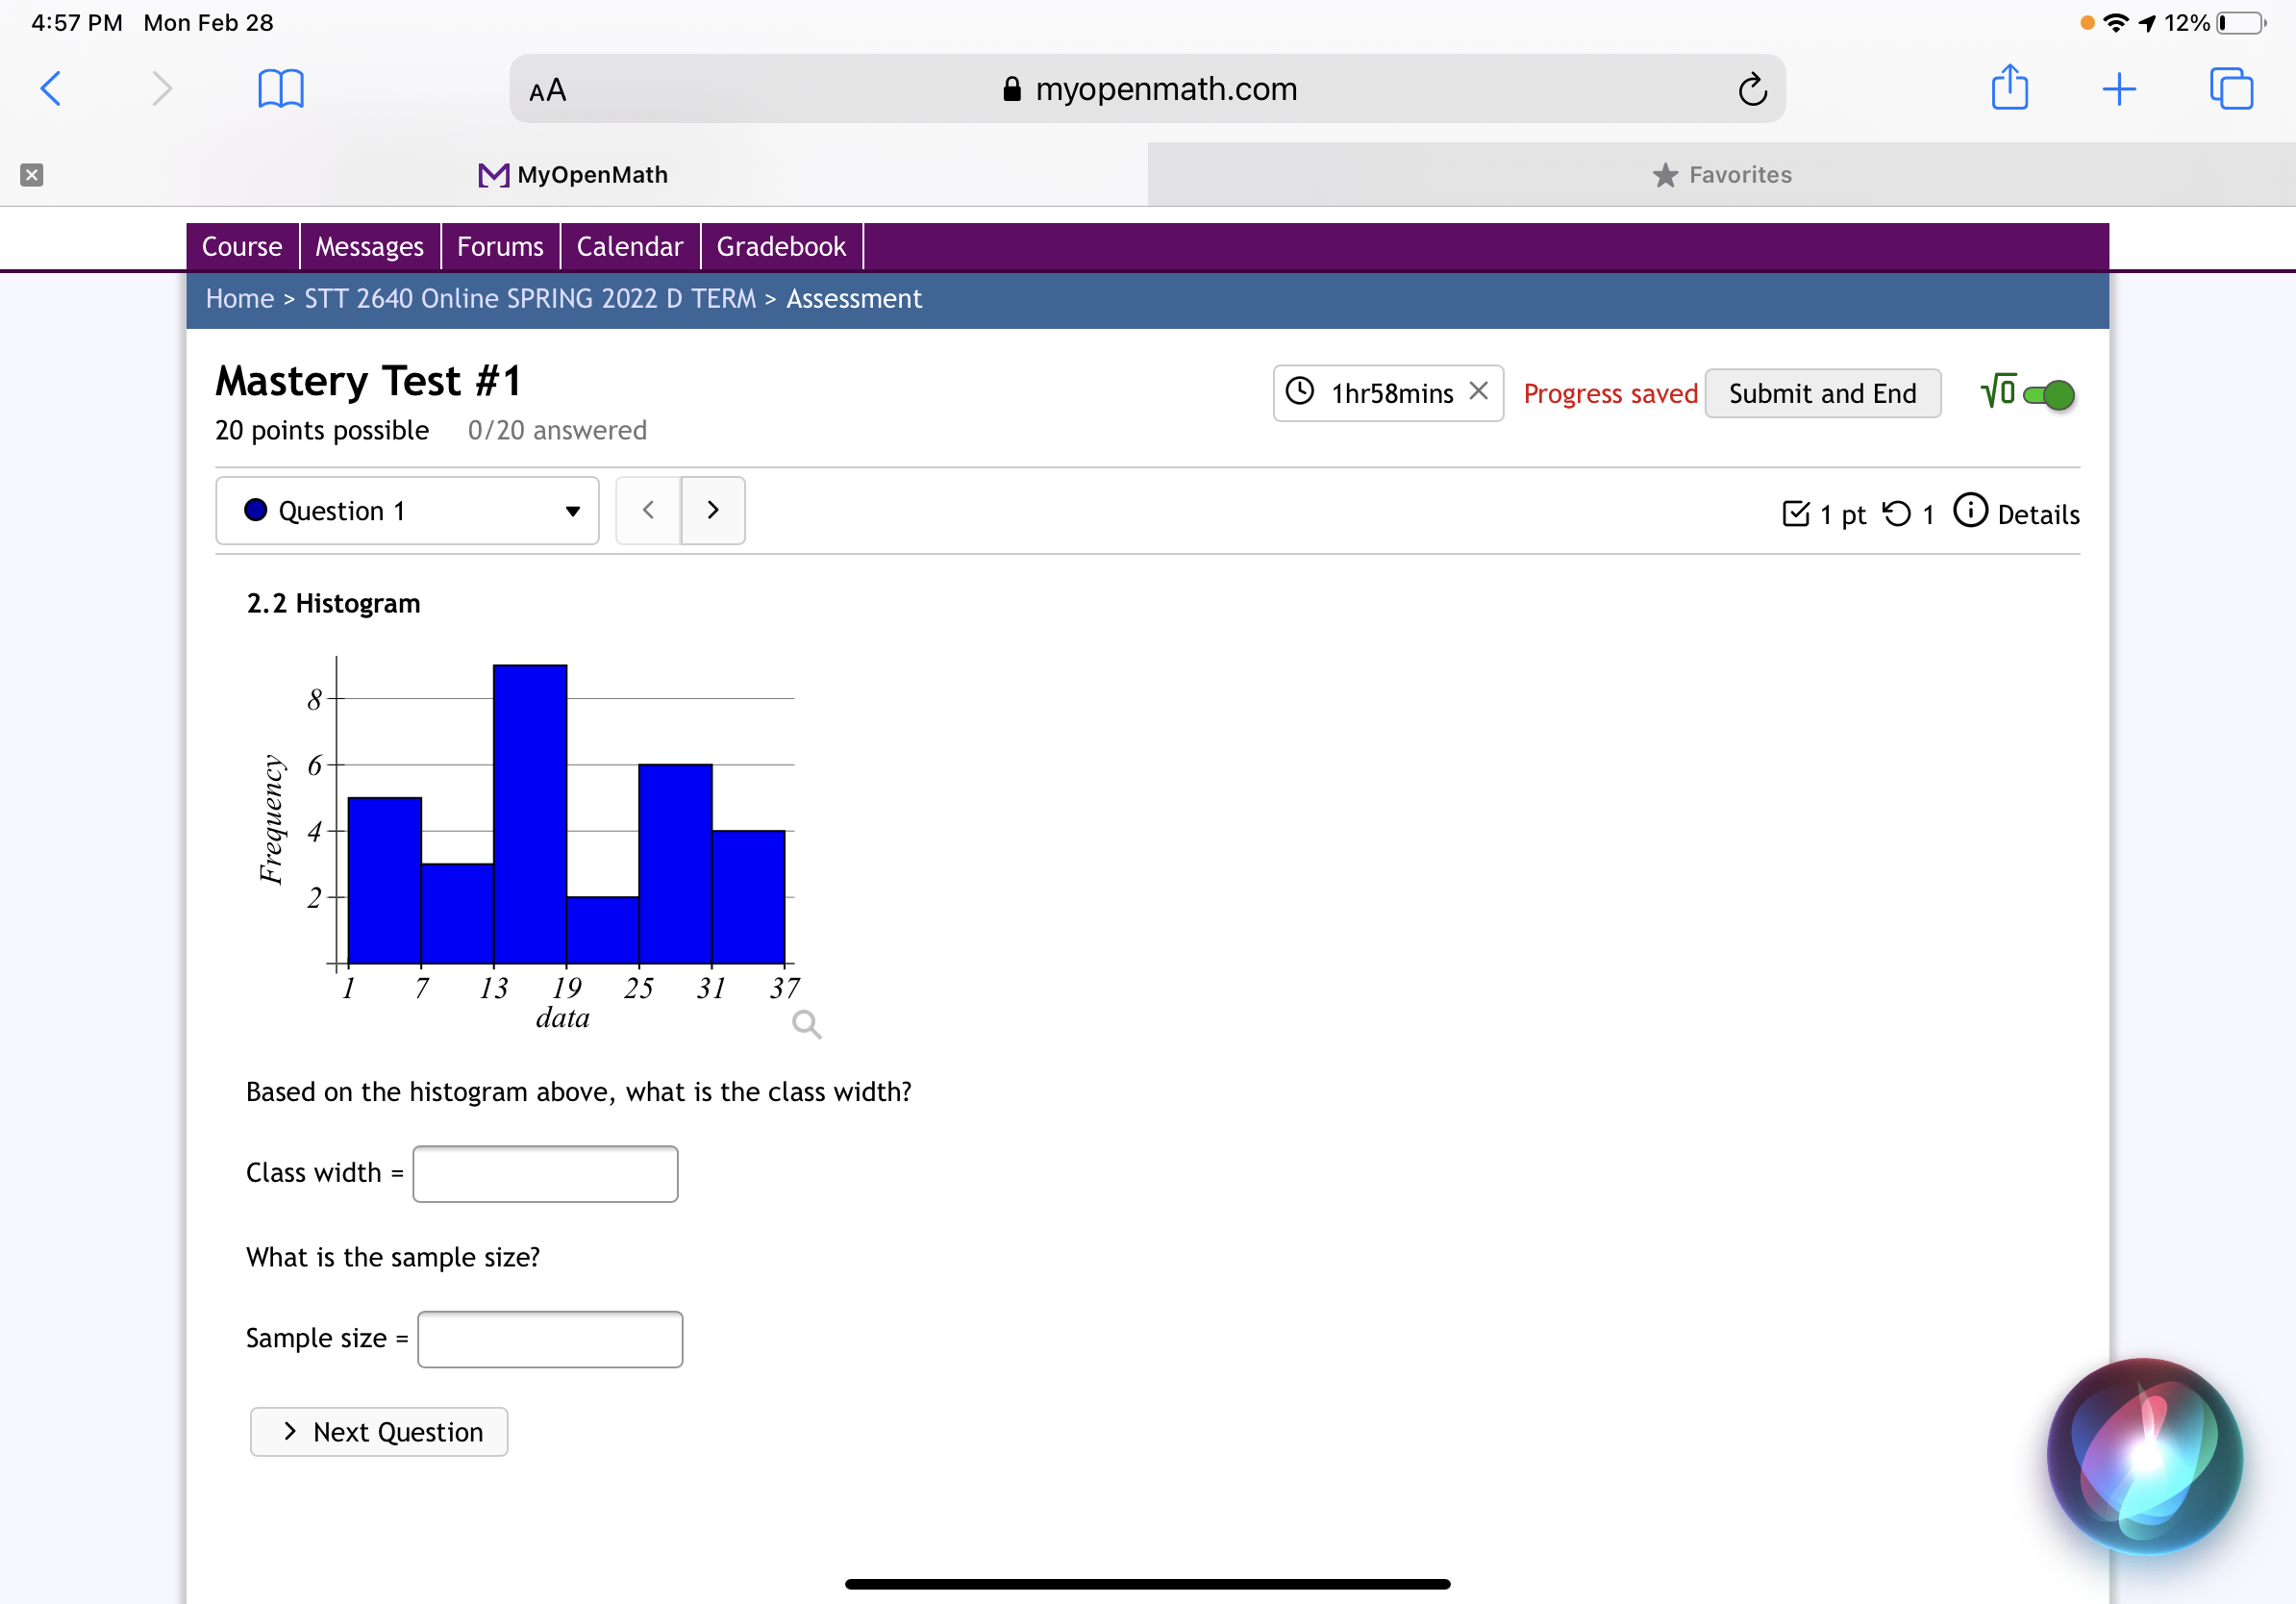
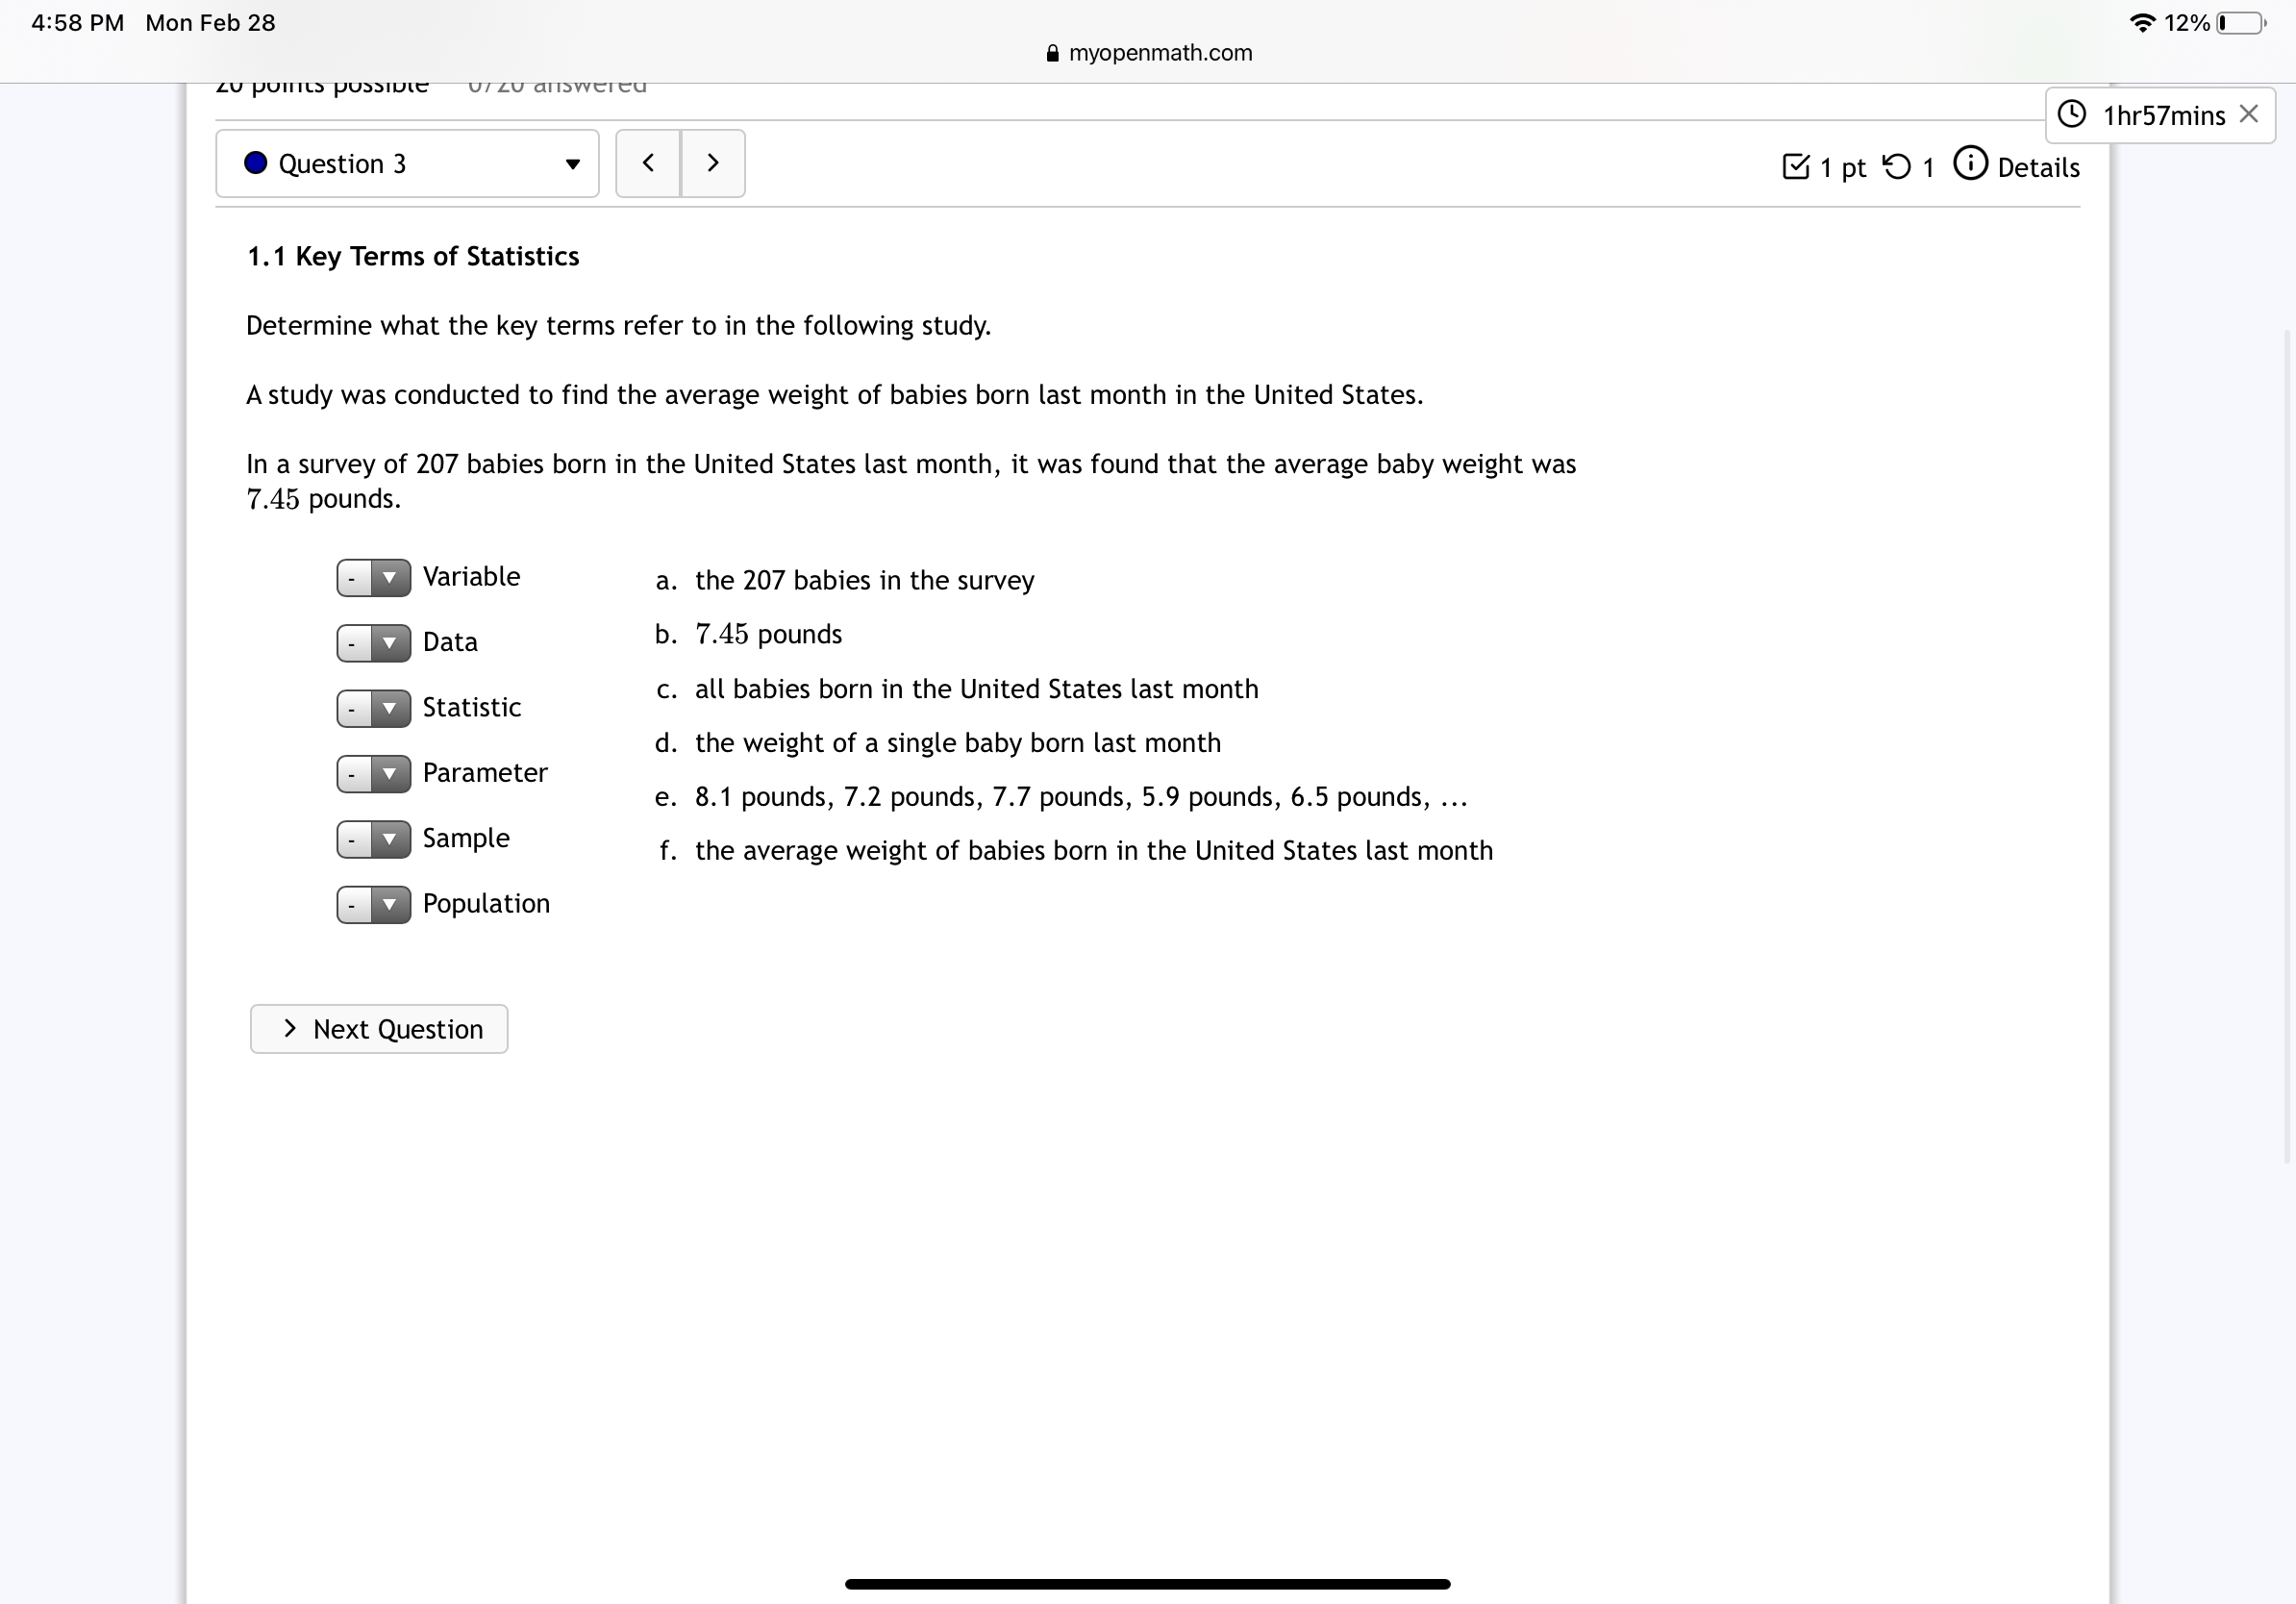
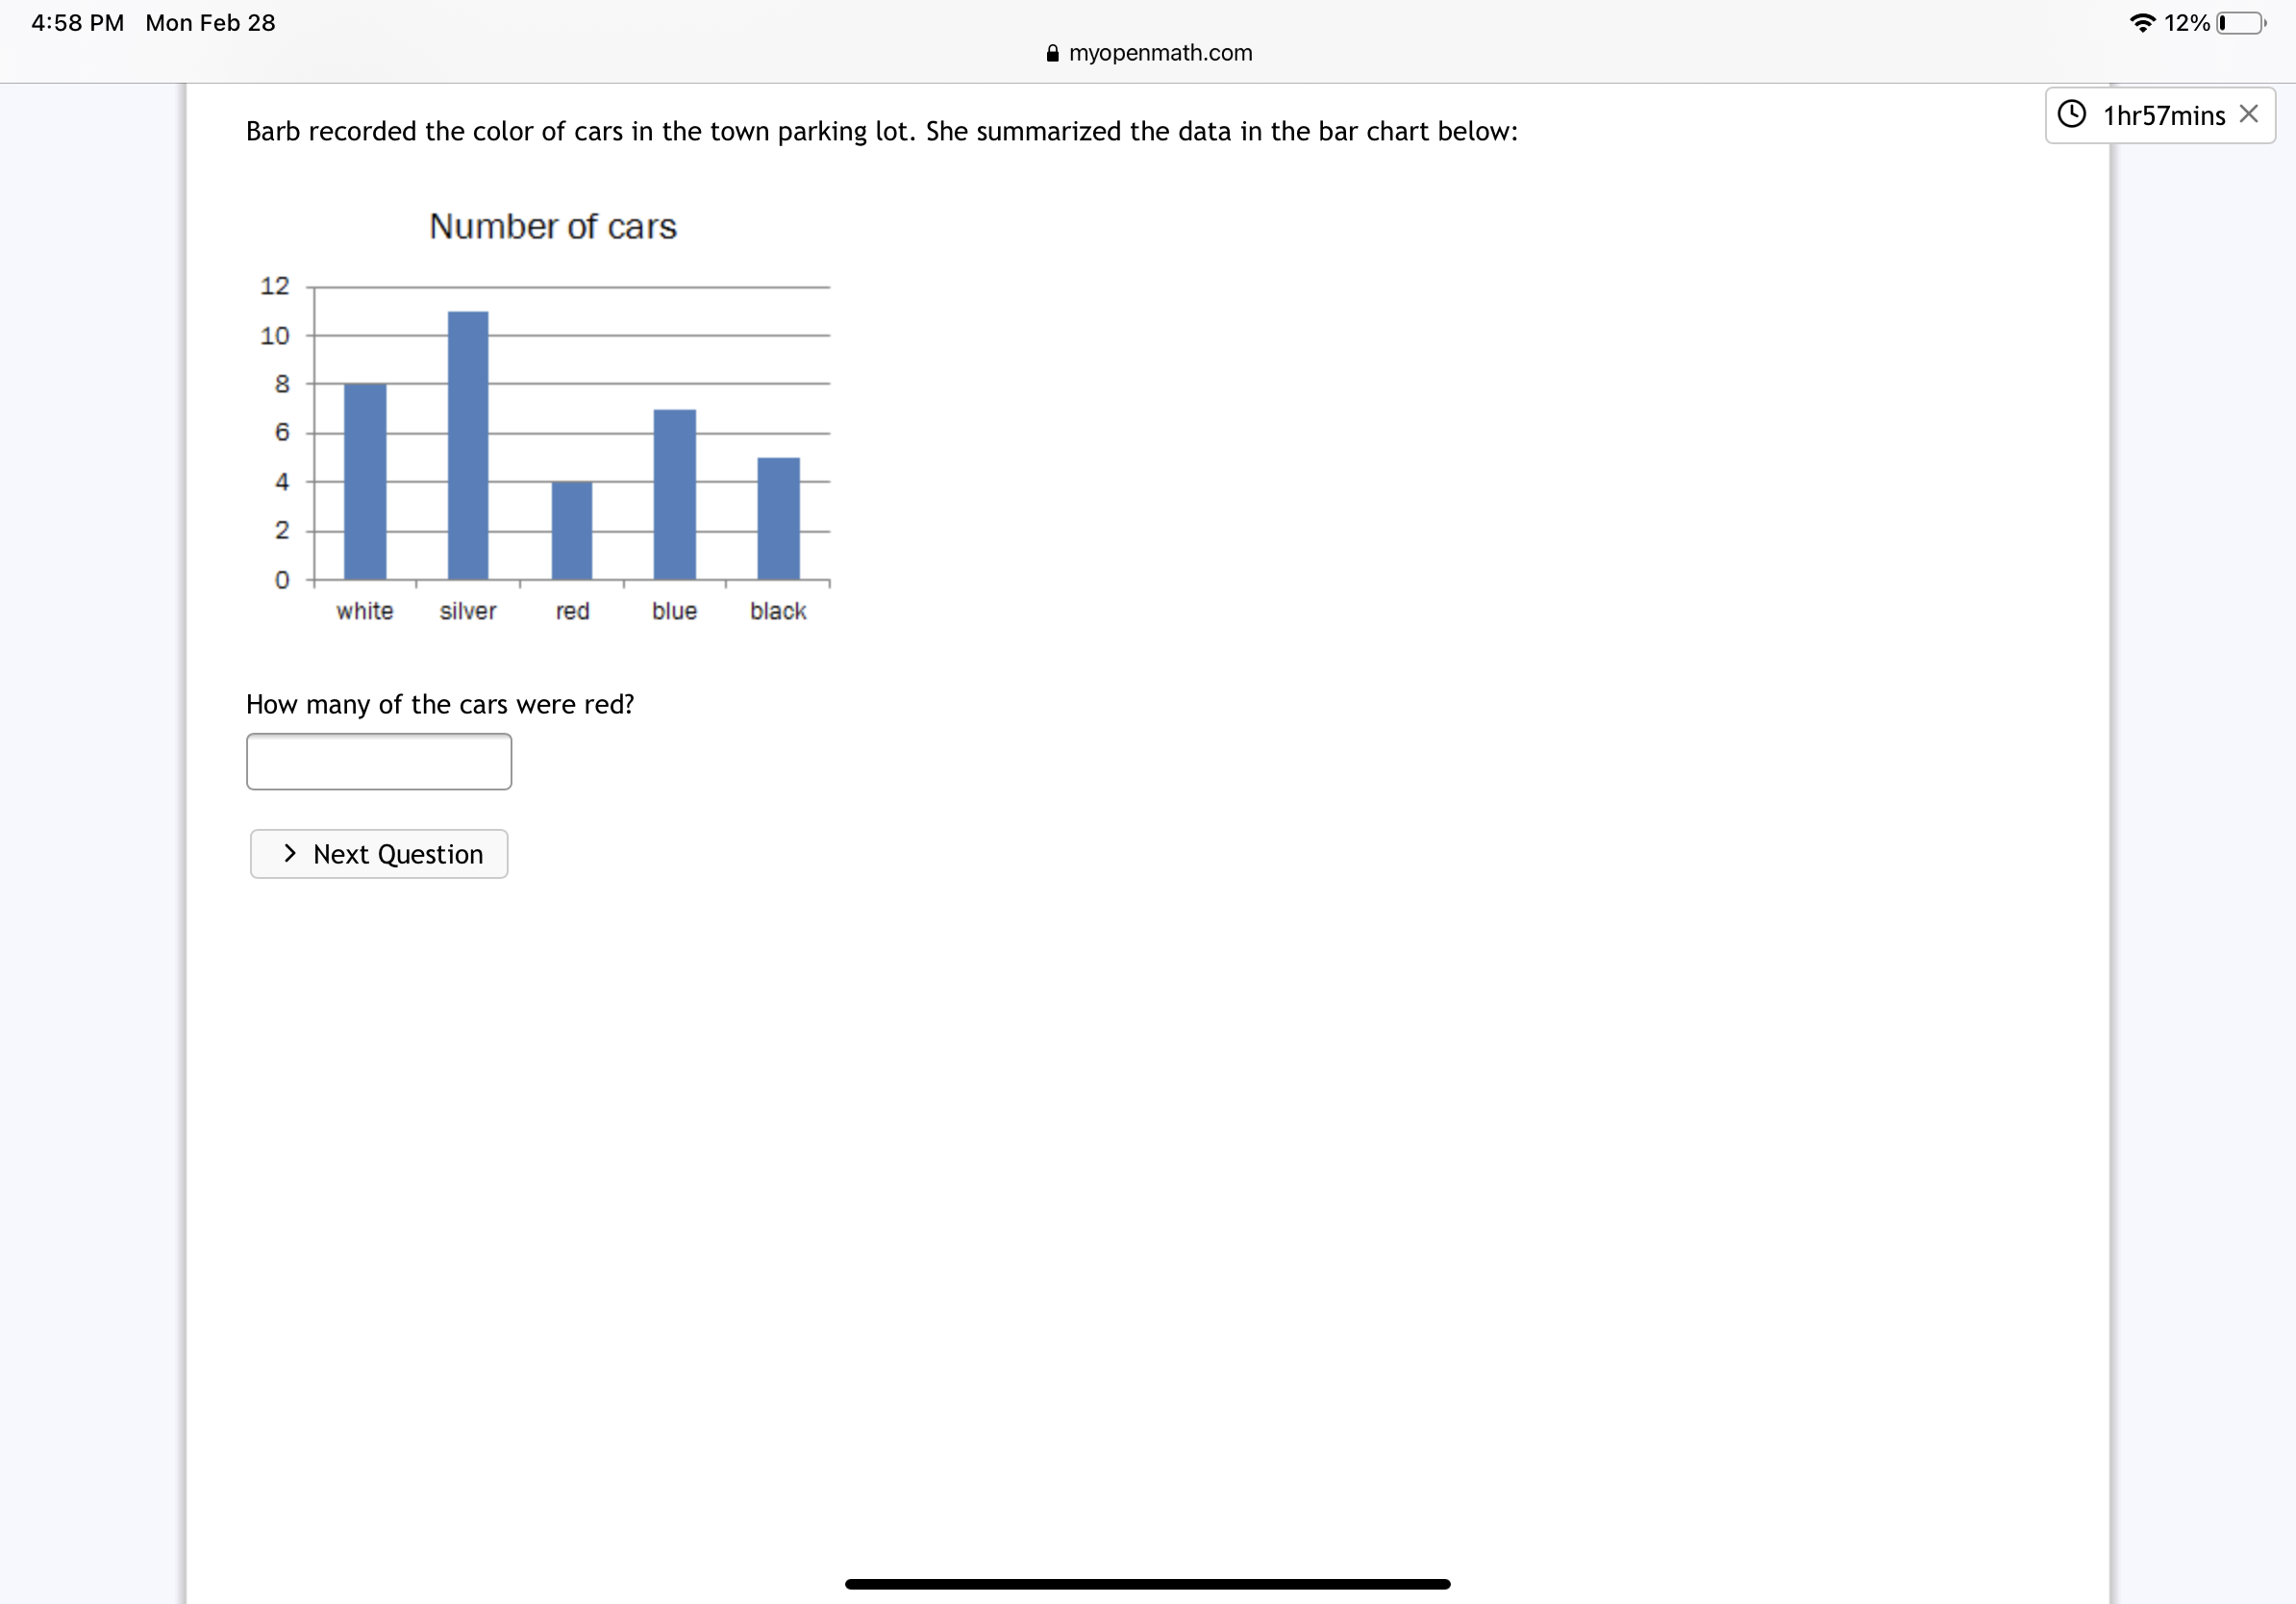
4:58 PM Mon Feb 28 12% myopenmath.com 2.4 Five Number Summary 1hr57mins X Find the Five Number Summary 15 4 9 8 18 6 27 45 41 49 31 40 38 Minimum = Q1 = Q2 Median = Q3 = Maximum = > Next Question4:58 PM Mon Feb 28 12% AA myopenmath.com C + X M MyOpenMath Favorites myOpenMath Home | My Classes . | User Settings | Log Out Dawn Phillips Course | Messages | Forums | Calendar | Gradebook Home > STT 2640 Online SPRING 2022 D TERM > Assessment Mastery Test #1 1hr57mins X Progress saved Submit and End Vo 20 points possible 0/20 answered Question 2 1 pt 9 1 0 Details 1.3 Level of Measure In a study, the data you collect are Temperature in Celsius. What is the level of measurement? nominal ordinal Ointerval ratio > Next Question4:57 PM Mon Feb 28 . 1 12% AA myopenmath.com C + X M MyOpenMath Favorites Course | Messages Forums | Calendar | Gradebook Home > STT 2640 Online SPRING 2022 D TERM > Assessment Mastery Test #1 1hr58mins X Progress saved Submit and End Voce 20 points possible 0/20 answered .Question 1 1pt 9 1 0 Details 2.2 Histogram Frequency + 7 13 19 25 31 37 data Based on the histogram above, what is the class width? Class width = What is the sample size? Sample size = > Next Question4:58 PM Mon Feb 28 myopenmath.com @12%C]~ 0 Question 3 v ' Next Question ' 4:58 PM Mon Feb 28 12% myopenmath.com Barb recorded the color of cars in the town parking lot. She summarized the data in the bar chart below: 1hr57mins X Number of cars 12 10 O white silver red blue black How many of the cars were red? > Next
Step by Step Solution
There are 3 Steps involved in it

Get step-by-step solutions from verified subject matter experts