

Question: 1. Consider the table showing the results of a reading examination of set of students. 138 Frequency Distribution of Scores in Mid-Term Examination in
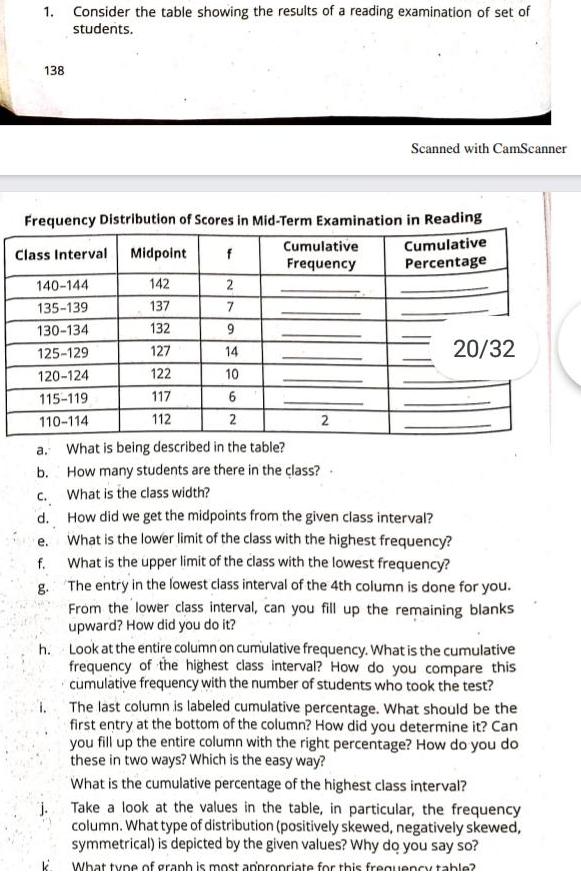
1. Consider the table showing the results of a reading examination of set of students. 138 Frequency Distribution of Scores in Mid-Term Examination in Reading Cumulative Percentage Class Interval Midpoint f 142 2 137 132 127 122 117 112 140-144 135-139 130-134 125-129 120-124 115-119 110-114 a. b. C. 7 9 14 10 6 2 Cumulative Frequency 2 k Scanned with CamScanner What is being described in the table? How many students are there in the class? What is the class width? . d. How did we get the midpoints from the given class interval? 20/32 e. f. What is the lower limit of the class with the highest frequency? What is the upper limit of the class with the lowest frequency? g. The entry in the lowest class interval of the 4th column is done for you. From the lower class interval, can you fill up the remaining blanks upward? How did you do it? h. Look at the entire column on cumulative frequency. What is the cumulative frequency of the highest class interval? How do you compare this cumulative frequency with the number of students who took the test? The last column is labeled cumulative percentage. What should be the first entry at the bottom of the column? How did you determine it? Can you fill up the entire column with the right percentage? How do you do these in two ways? Which is the easy way? What is the cumulative percentage of the highest class interval? Take a look at the values in the table, in particular, the frequency column. What type of distribution (positively skewed, negatively skewed, symmetrical) is depicted by the given values? Why do you say so? What tune of graph is most appropriate for this frequency tahle?
Step by Step Solution
3.54 Rating (157 Votes )
There are 3 Steps involved in it
class interval midpoint frequency cumulative frequency cumulative percentage 140144 142 2 50 100 135... View full answer

Get step-by-step solutions from verified subject matter experts