

Question: Refer to Data Set 6 in Appendix B and find the proportion of male bears included in the study. Use a 0.05 significance level to
Refer to Data Set 6 in Appendix B and find the proportion of male bears included in the study. Use a 0.05 significance level to test the claim that when the bears were selected, they were selected from a population in which the percentage of males is equal to 50%.
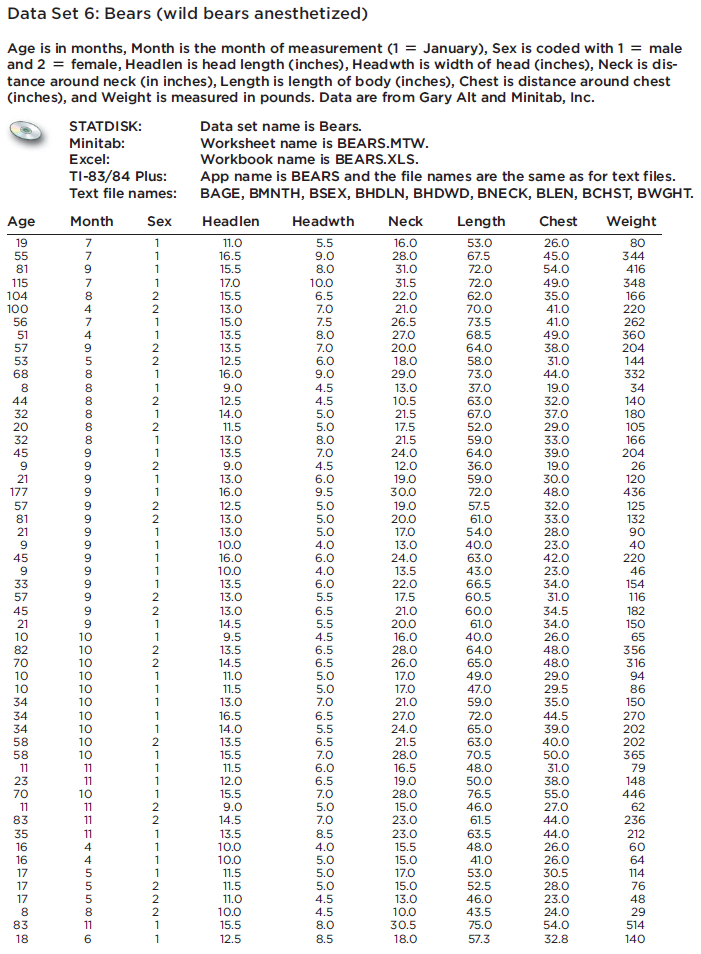
Data Set 6: Bears (wild bears anesthetized) Age is in months, Month is the month of measurement (1 = January), Sex is coded with 1 = male and 2 = female, Headlen is head length (inches), Headwth is width of head (inches), Neck is dis- tance around neck (in inches), Length is length of body (inches), Chest is distance around chest (inches), and Weight is measured in pounds. Data are from Gary Alt and Minitab, Inc. Age 19515 104 100 565738842202459177519593751102010 104445858=B013566VVV8BB 81 23 70 17 17 17 STATDISK: Minitab: Excel: TI-83/84 Plus: Text file names: Month TG784 00 00 00 00 00 00 aaaaaaaaaaa99999999FFOFFETTIIN 80 = 6 9 7 8 8 8 10 10 10 10 10 10 10 10 10 10 11 11 10 11 11 11 4 Sex 1 1 1 1 2 2 1 1 2 2 1 2 1 2 1 2 2 1 1 1 2 2 1 1 1 2 1 1 2 1 2222N__ Data set name is Bears. Worksheet name is BEARS.MTW. Workbook name is BEARS.XLS. App name is BEARS and the file names are the same as for text files. BAGE, BMNTH, BSEX, BHDLN, BHDWD, BNECK, BLEN, BCHST, BWGHT. Headlen Headwth 11.0 16.5 15.5 17.0 15.5 13.0 15.0 13.5 13.5 12.5 16.0 9.0 12.5 14.0 11.5 13.0 13.5 9.0 13.0 16.0 12.5 13.0 13.0 10.0 16.0 10.0 13.5 13.0 13.0 14.5 9.5 13.5 14.5 11.0 11.5 13.0 16.5 14.0 13.5 15.5 11.5 12.0 15.5 9.0 14.5 13.5 10.0 10.0 11.5 11.5 11.0 10.0 15.5 12.5 5.5 9.0 8.0 10.0 6.5 7.0 7.5 8.0 7.0 6.0 9.0 4.5 4.5 5.0 5.0 8.0 7.0 4.5 6.0 9.5 5.0 5.0 5.0 4.0 6.0 4.0 6.0 5.5 6.5 5.5 4.5 6.5 6.5 5.0 5.0 7.0 6.5 5.5 6.5 7.0 6.0 6.5 7.0 5.0 7.0 8.5 4.0 5.0 5.0 5.0 4.5 4.5 8.0 8.5 Neck 16.0 28.0 31.0 31.5 22.0 21.0 26.5 27.0 20.0 18.0 29.0 13.0 10.5 21.5 17.5 21.5 24.0 12.0 19.0 30.0 19.0 20.0 17.0 13.0 24.0 13.5 22.0 17.5 21.0 20.0 16.0 28.0 26.0 17.0 17.0 21.0 27.0 24.0 21.5 28.0 16.5 19.0 28.0 15.0 23.0 23.0 15.5 15.0 17.0 15.0 13.0 10.0 30.5 18.0 Length Chest 53.0 67.5 72.0 72.0 62.0 70.0 73.5 68.5 64.0 58.0 73.0 37.0 63.0 67.0 52.0 59.0 64.0 36.0 59.0 72.0 57.5 61.0 54.0 40.0 63.0 43.0 66.5 60.5 60.0 61.0 40.0 64.0 65.0 49.0 47.0 59.0 72.0 65.0 63.0 70.5 48.0 50.0 76.5 46.0 61.5 63.5 48.0 41.0 53.0 52.5 46.0 43.5 75.0 57.3 26.0 45.0 54.0 49.0 35.0 41.0 41.0 49.0 38.0 31.0 44.0 19.0 32.0 37.0 29.0 33.0 39.0 19.0 30.0 48.0 32.0 33.0 28.0 23.0 42.0 23.0 34.0 31.0 34.5 34.0 26.0 48.0 48.0 29.0 29.5 35.0 44.5 39.0 40.0 50.0 31.0 38.0 55.0 27.0 44.0 44.0 26.0 26.0 30.5 28.0 23.0 24.0 54.0 32.8 Weight 80 344 416 348 166 220 262 360 204 144 332 34 140 180 105 166 204 26 120 436 125 132 90 40 220 46 154 116 182 150 65 356 316 94 86 150 270 202 202 365 79 148 446 62 236 212 60 64 114 76 48 29 514 140
Step by Step Solution
3.39 Rating (161 Votes )
There are 3 Steps involved in it
Answer The proportion of male bears in the study is 062 To ... View full answer

Get step-by-step solutions from verified subject matter experts