

Question: 475 The graph below represents the height above the ground h in inches of a point on a triathlete s bike wheel during a training

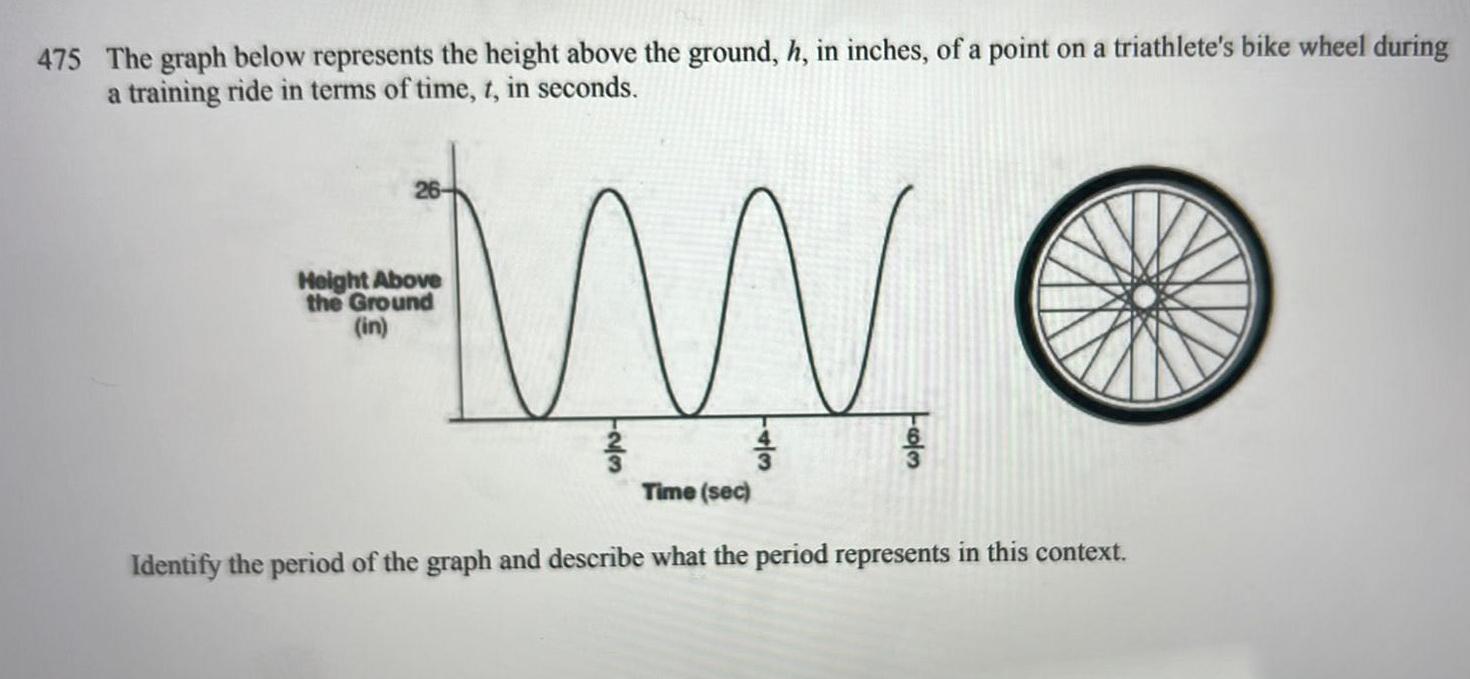
475 The graph below represents the height above the ground h in inches of a point on a triathlete s bike wheel during a training ride in terms of time t in seconds M Height Above the Ground in 2 3 4 3 63 Time sec Identify the period of the graph and describe what the period represents in this context
Step by Step Solution
There are 3 Steps involved in it
1 Expert Approved Answer
Step: 1 Unlock

Question Has Been Solved by an Expert!
Get step-by-step solutions from verified subject matter experts
Step: 2 Unlock
Step: 3 Unlock