

Question: 4a. In the table below is data for two companies in a very competitive industry. ($000) Company A Company B Revenues(sales) 70,500 80,000 Cost of
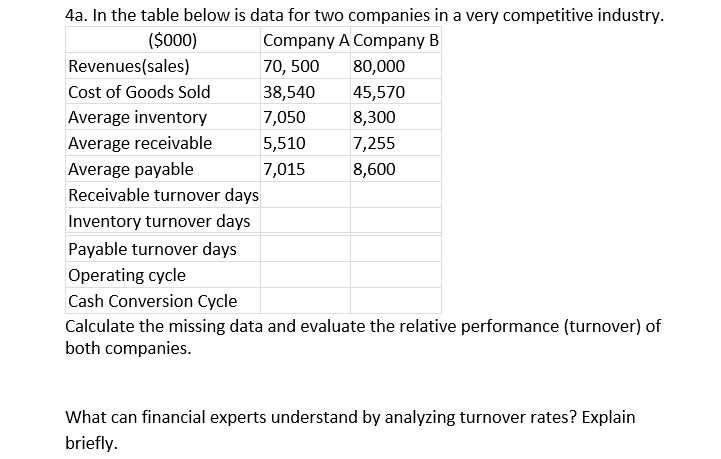
4a. In the table below is data for two companies in a very competitive industry. ($000) Company A Company B Revenues(sales) 70,500 80,000 Cost of Goods Sold 38,540 45,570 Average inventory 7,050 8,300 Average receivable 5,510 7,255 Average payable 7,015 8,600 Receivable turnover days Inventory turnover days Payable turnover days Operating cycle Cash Conversion Cycle Calculate the missing data and evaluate the relative performance (turnover) of both companies. What can financial experts understand by analyzing turnover rates? Explain briefly
Step by Step Solution
There are 3 Steps involved in it
1 Expert Approved Answer
Step: 1 Unlock

Question Has Been Solved by an Expert!
Get step-by-step solutions from verified subject matter experts
Step: 2 Unlock
Step: 3 Unlock