

Question: 4)Use the information in the table and graph below to answer the question. Cash Flow Year Project 1 Project 2 0 -$22 -$47 1 $9
4)Use the information in the table and graph below to answer the question.
| Cash Flow | ||
| Year | Project 1 | Project 2 |
| 0 | -$22 | -$47 |
| 1 | $9 | $20 |
| 2 | $12 | $20 |
| 3 | $11 | $25 |
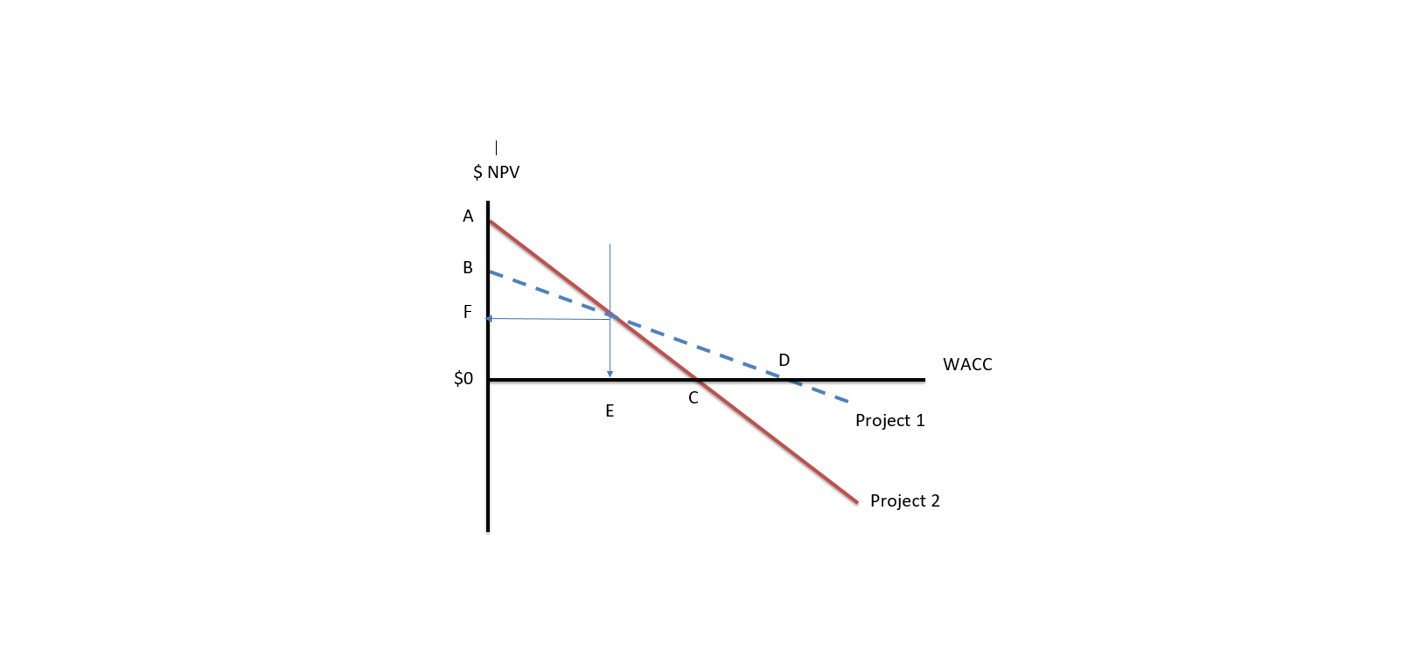
What is the $NPV of the point F on the graph?
| $2.91 |
| $2.31 |
| $2.12 |
| $2.46 |
| $2.71 |
$ NPV WACC $0 Project 1 Project 2
Step by Step Solution
There are 3 Steps involved in it
1 Expert Approved Answer
Step: 1 Unlock

Question Has Been Solved by an Expert!
Get step-by-step solutions from verified subject matter experts
Step: 2 Unlock
Step: 3 Unlock