

Question: 5. (10 points) Part dimension data from the same process in question 2 are displayed in the frequency distribution table below. The data are the
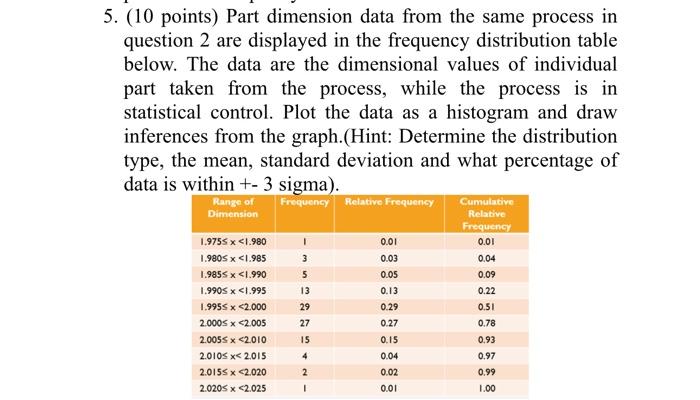
5. (10 points) Part dimension data from the same process in question 2 are displayed in the frequency distribution table below. The data are the dimensional values of individual part taken from the process, while the process is in statistical control. Plot the data as a histogram and draw inferences from the graph.(Hint: Determine the distribution type, the mean, standard deviation and what percentage of data is within +-3 sigma). 5. (10 points) Part dimension data from the same process in question 2 are displayed in the frequency distribution table below. The data are the dimensional values of individual part taken from the process, while the process is in statistical control. Plot the data as a histogram and draw inferences from the graph.(Hint: Determine the distribution type, the mean, standard deviation and what percentage of data is within +-3 sigma)
Step by Step Solution
There are 3 Steps involved in it

Get step-by-step solutions from verified subject matter experts