

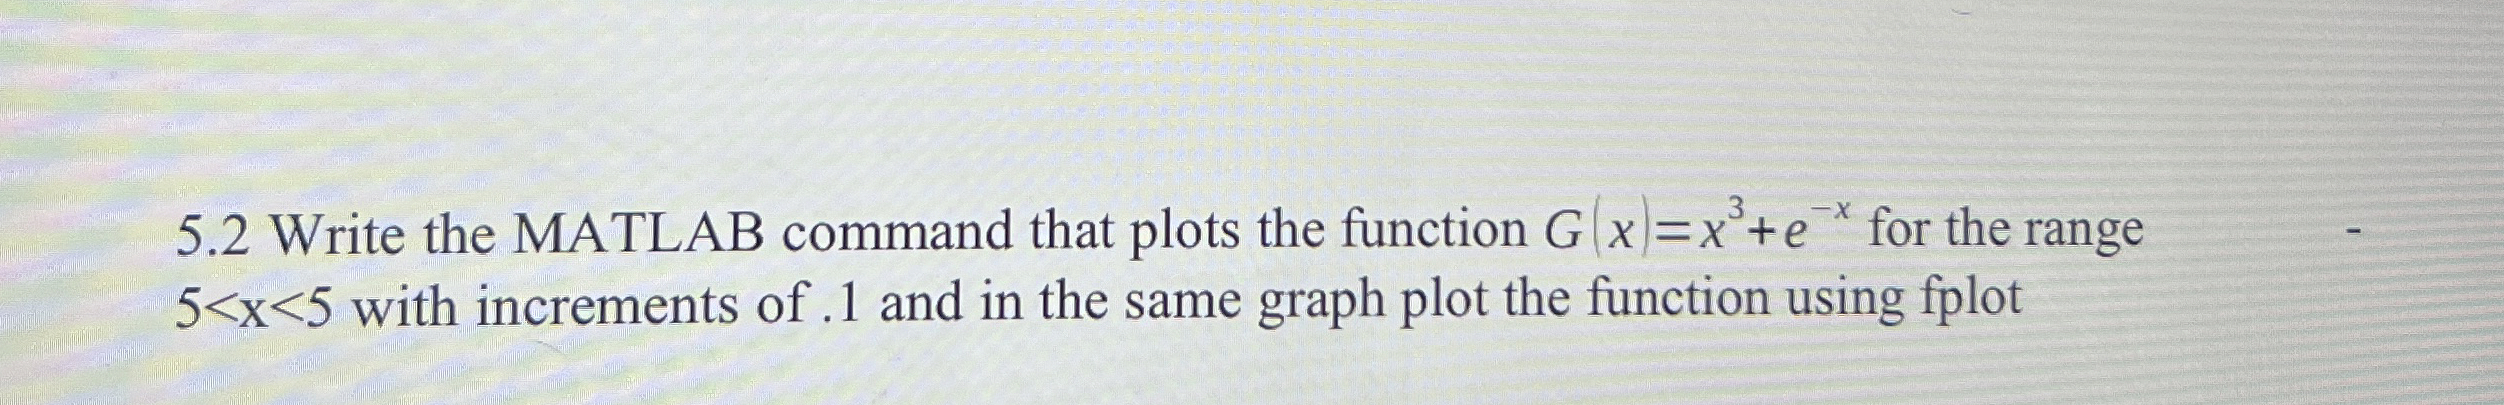
Question: 5 . 2 Write the MATLAB command that plots the function G ( x ) = x 3 + e - x for the range
Write the MATLAB command that plots the function for the range with increments and the same graph plot the function using fplot
Step by Step Solution
There are 3 Steps involved in it
1 Expert Approved Answer
Step: 1 Unlock

Question Has Been Solved by an Expert!
Get step-by-step solutions from verified subject matter experts
Step: 2 Unlock
Step: 3 Unlock