

Question: 5 . 3 5 Plot a Function ) Write a program to print a plot of s i n ( x ) , from x
Plot a Function
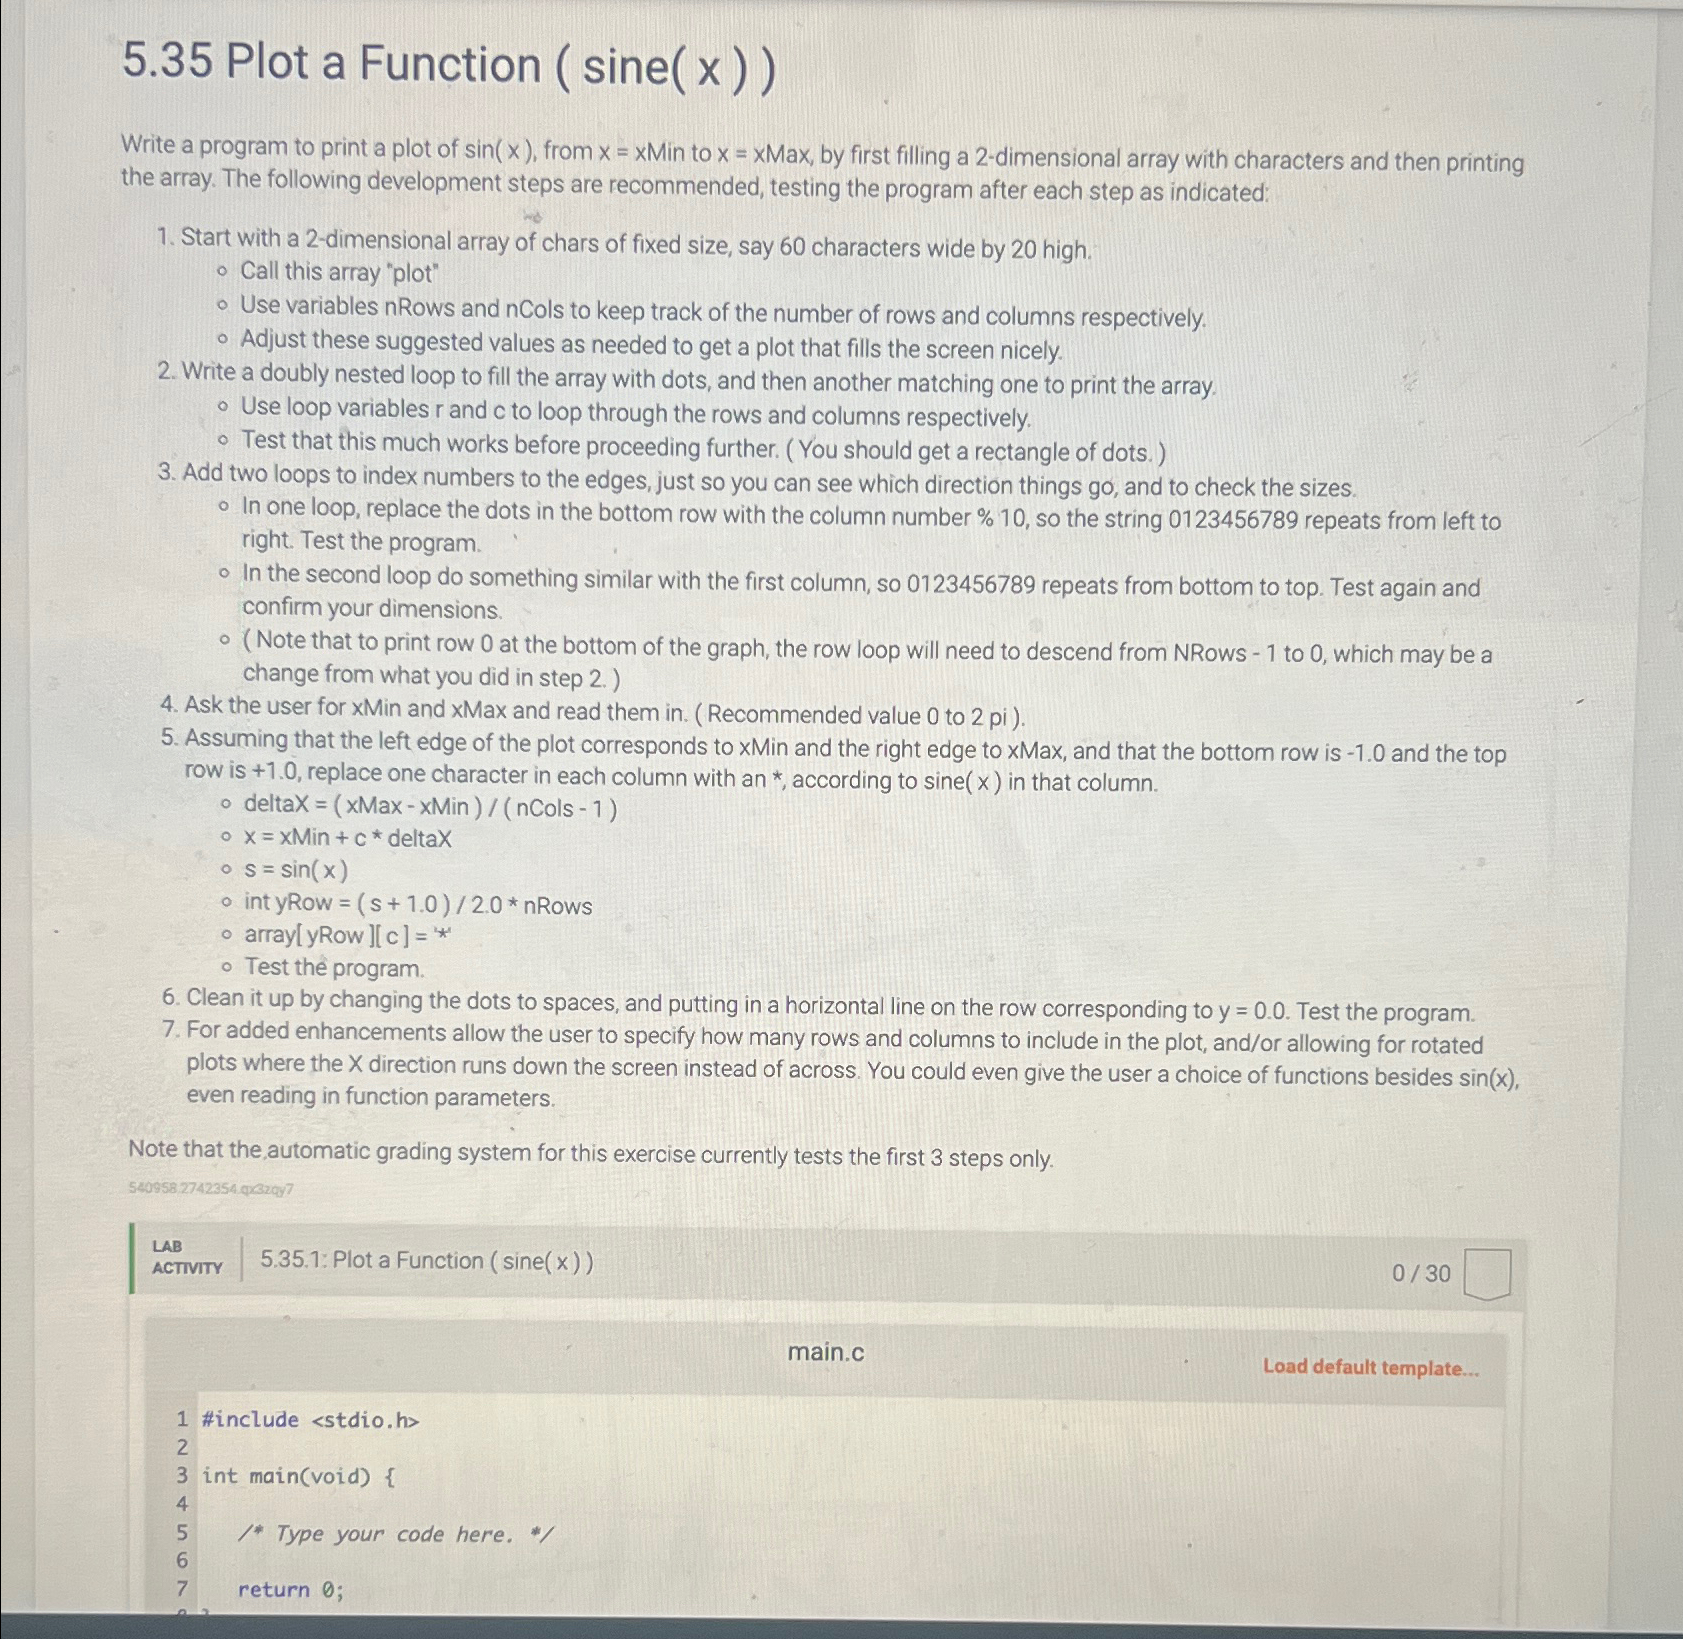
Write a program to print a plot of from Min to Max, by first filling a dimensional array with characters and then printing the array. The following development steps are recommended, testing the program after each step as indicated:
Start with a dimensional array of chars of fixed size, say characters wide by high.
Call this array "plot"
Use variables nRows and nCols to keep track of the number of rows and columns respectively.
Adjust these suggested values as needed to get a plot that fills the screen nicely.
Write a doubly nested loop to fill the array with dots, and then another matching one to print the array.
Use loop variables and to loop through the rows and columns respectively.
Test that this much works before proceeding further. You should get a rectangle of dots.
Add two loops to index numbers to the edges, just so you can see which direction things go and to check the sizes.
In one loop, replace the dots in the bottom row with the column number so the string repeats from left to right. Test the program.
In the second loop do something similar with the first column, so repeats from bottom to top. Test again and confirm your dimensions.
Note that to print row at the bottom of the graph, the row loop will need to descend from NRows to which may be a change from what you did in step
Ask the user for XMin and Max and read them inRecommended value to pi
Assuming that the left edge of the plot corresponds to XMin and the right edge to XMax, and that the bottom row is and the top row is replace one character in each column with an according to sine in that column.
deltaX Max Min
Step by Step Solution
There are 3 Steps involved in it
1 Expert Approved Answer
Step: 1 Unlock

Question Has Been Solved by an Expert!
Get step-by-step solutions from verified subject matter experts
Step: 2 Unlock
Step: 3 Unlock