

Question: 5 3 Problem #1 4 Selected comparative financial statement information of Meyer Inc. follows. 5 6 Meyer Inc. 7 Comparative Year-End Balance Sheets 8 At
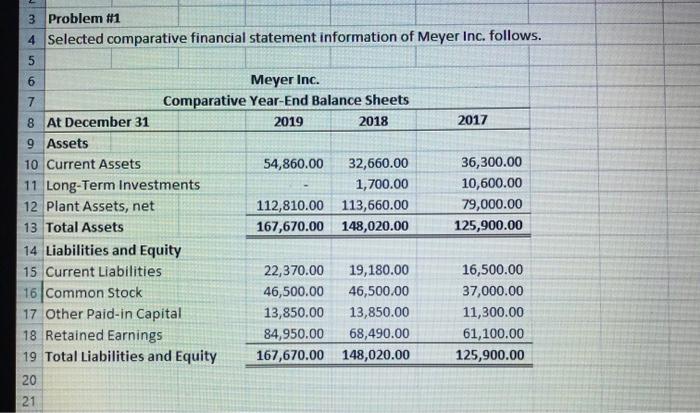
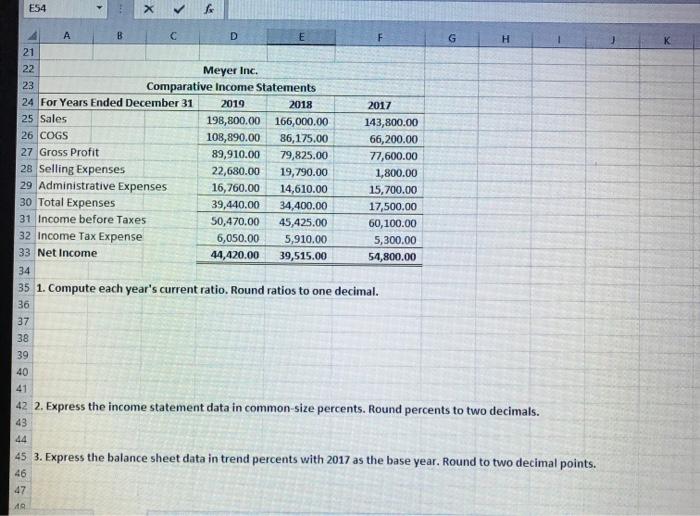
5 3 Problem #1 4 Selected comparative financial statement information of Meyer Inc. follows. 5 6 Meyer Inc. 7 Comparative Year-End Balance Sheets 8 At December 31 2019 2018 2017 9 Assets 10 Current Assets 54,860.00 32,660.00 36,300.00 11 Long-Term Investments 1,700.00 10,600.00 12 Plant Assets, net 112,810.00 113,660.00 79,000.00 13 Total Assets 167,670.00 148,020.00 125,900.00 14 Liabilities and Equity 15 Current Liabilities 22,370.00 19,180.00 16,500.00 16 Common Stock 46,500.00 46,500.00 37,000.00 17 Other Paid-in Capital 13,850.00 13,850.00 11,300.00 18 Retained Earnings 84,950.00 68,490.00 61,100.00 19 Total Liabilities and Equity 167,670.00 148,020.00 125,900.00 20 21 E54 f G H A B D F 21 22 Meyer Inc. 23 Comparative Income Statements 24 For Years Ended December 31 2019 2018 2017 25 Sales 198,800.00 166,000.00 143,800.00 26 COGS 108,890.00 86,175.00 66,200.00 27 Gross Profit 89,910.00 79,825.00 77,600.00 28 Selling Expenses 22,680.00 19,790.00 1,800.00 29 Administrative Expenses 16,760.00 14,610.00 15,700.00 30 Total Expenses 39,440.00 34,400.00 17,500.00 31 Income before Taxes 50,470.00 45,425.00 60,100.00 32 Income Tax Expense 6,050.00 5,910.00 5,300.00 33 Net Income 44,420.00 39,515.00 54,800.00 34 35 1. Compute each year's current ratio. Round ratios to one decimal. 36 37 38 39 40 42 2. Express the income statement data in common-size percents. Round percents to two decimals. 43 44 45 3. Express the balance sheet data in trend percents with 2017 as the base year. Round to two decimal points. 46 47 19
Step by Step Solution
There are 3 Steps involved in it

Get step-by-step solutions from verified subject matter experts