

Question: 5. (32 points) The table below describes the color distribution of plain M&M's candies produced at the Cleveland, Tennessee factory as of 2017 (source
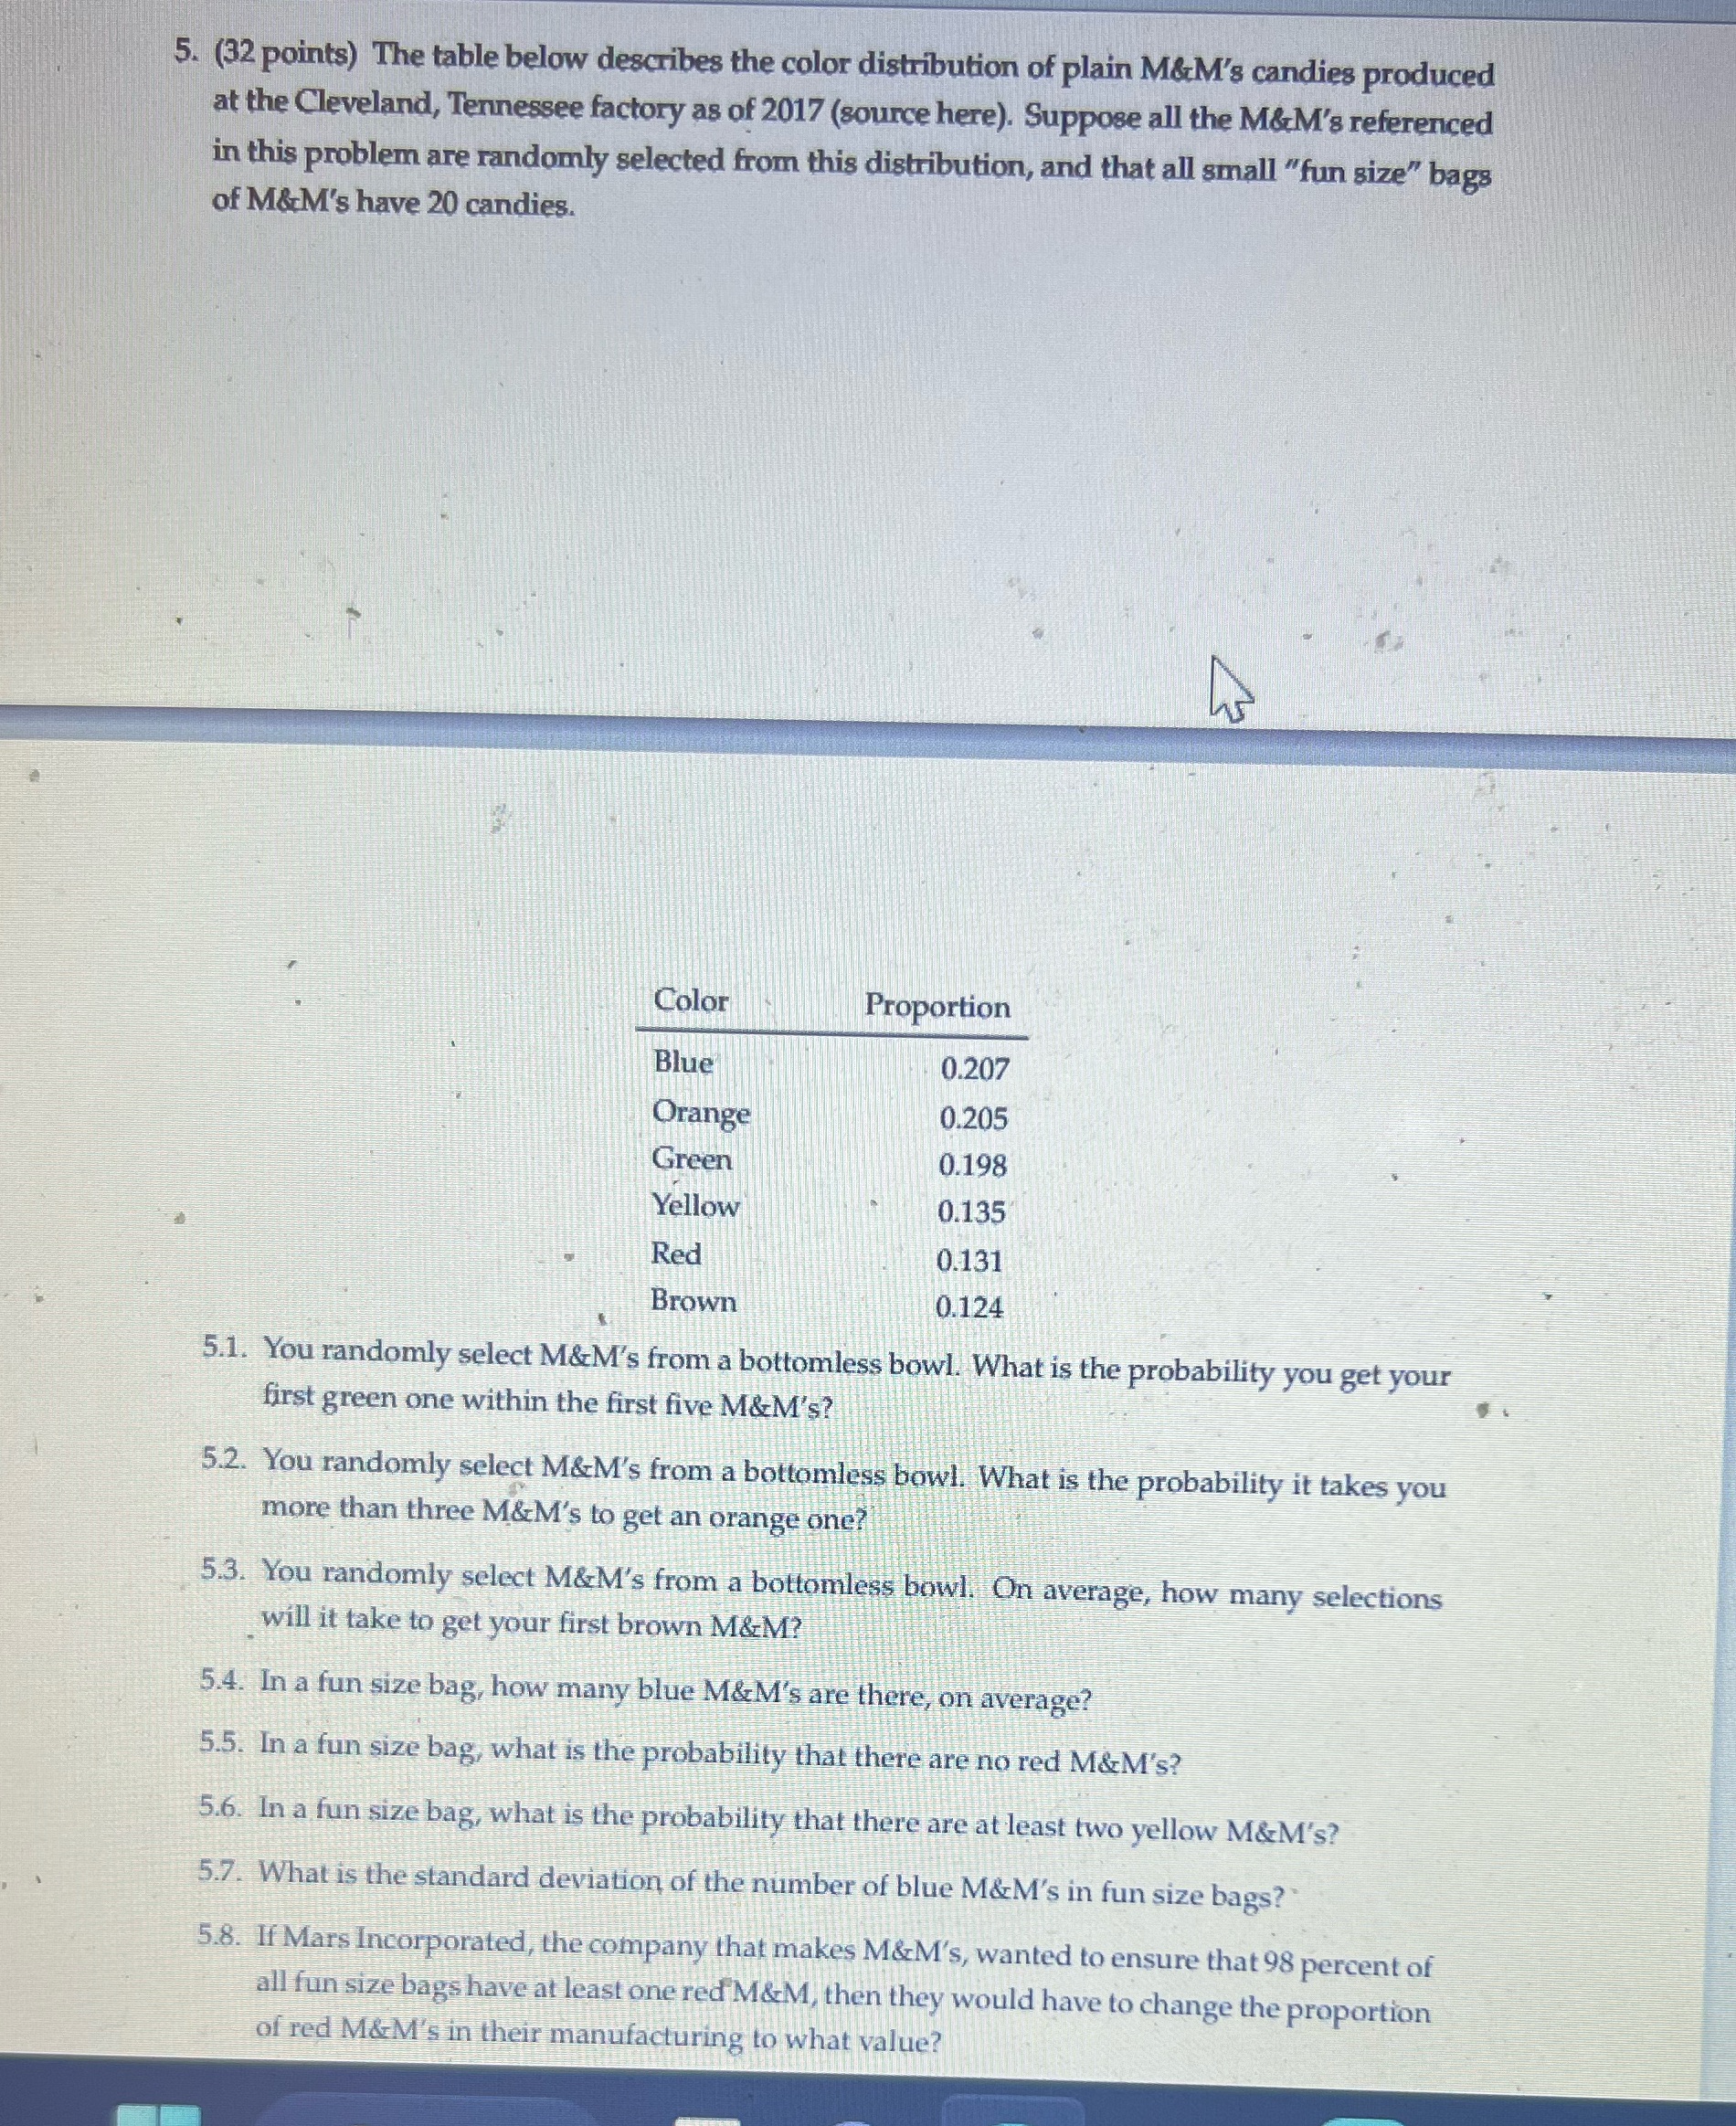
5. (32 points) The table below describes the color distribution of plain M&M's candies produced at the Cleveland, Tennessee factory as of 2017 (source here). Suppose all the M&M's referenced in this problem are randomly selected from this distribution, and that all small "fun size" bags of M&M's have 20 candies. Color Proportion Blue 0.207 Orange 0.205 Green 0.198 Yellow 0.135 Red 0.131 Brown 0.124 5.1. You randomly select M&M's from a bottomless bowl. What is the probability you get your first green one within the first five M&M's? 5.2. You randomly select M&M's from a bottomless bowl. What is the probability it takes you more than three M&M's to get an orange one? 5.3. You randomly select M&M's from a bottomless bowl. On average, how many selections will it take to get your first brown M&M? 5.4. In a fun size bag, how many blue M&M's are there, on average? 5.5. In a fun size bag, what is the probability that there are no red M&M's? 5.6. In a fun size bag, what is the probability that there are at least two yellow M&M's? 5.7. What is the standard deviation of the number of blue M&M's in fun size bags? 5.8. If Mars Incorporated, the company that makes M&M's, wanted to ensure that 98 percent of all fun size bags have at least one red M&M, then they would have to change the proportion of red M&M's in their manufacturing to what value?
Step by Step Solution
There are 3 Steps involved in it

Get step-by-step solutions from verified subject matter experts