

Question: 5) A sample is a subset from a ____ Random survey Population Tally Frequency distribution 6) Which statement is most true about the simple average


5) A sample is a subset from a ____
Random survey
Population
Tally
Frequency distribution
6) Which statement is most true about the simple average (or mean)?
The mean is sensitive to extreme values
The mean is not sensitive to extreme values
One need not know how many observations are in a data set to calculate the mean.
The mean describes the middle number.
7)
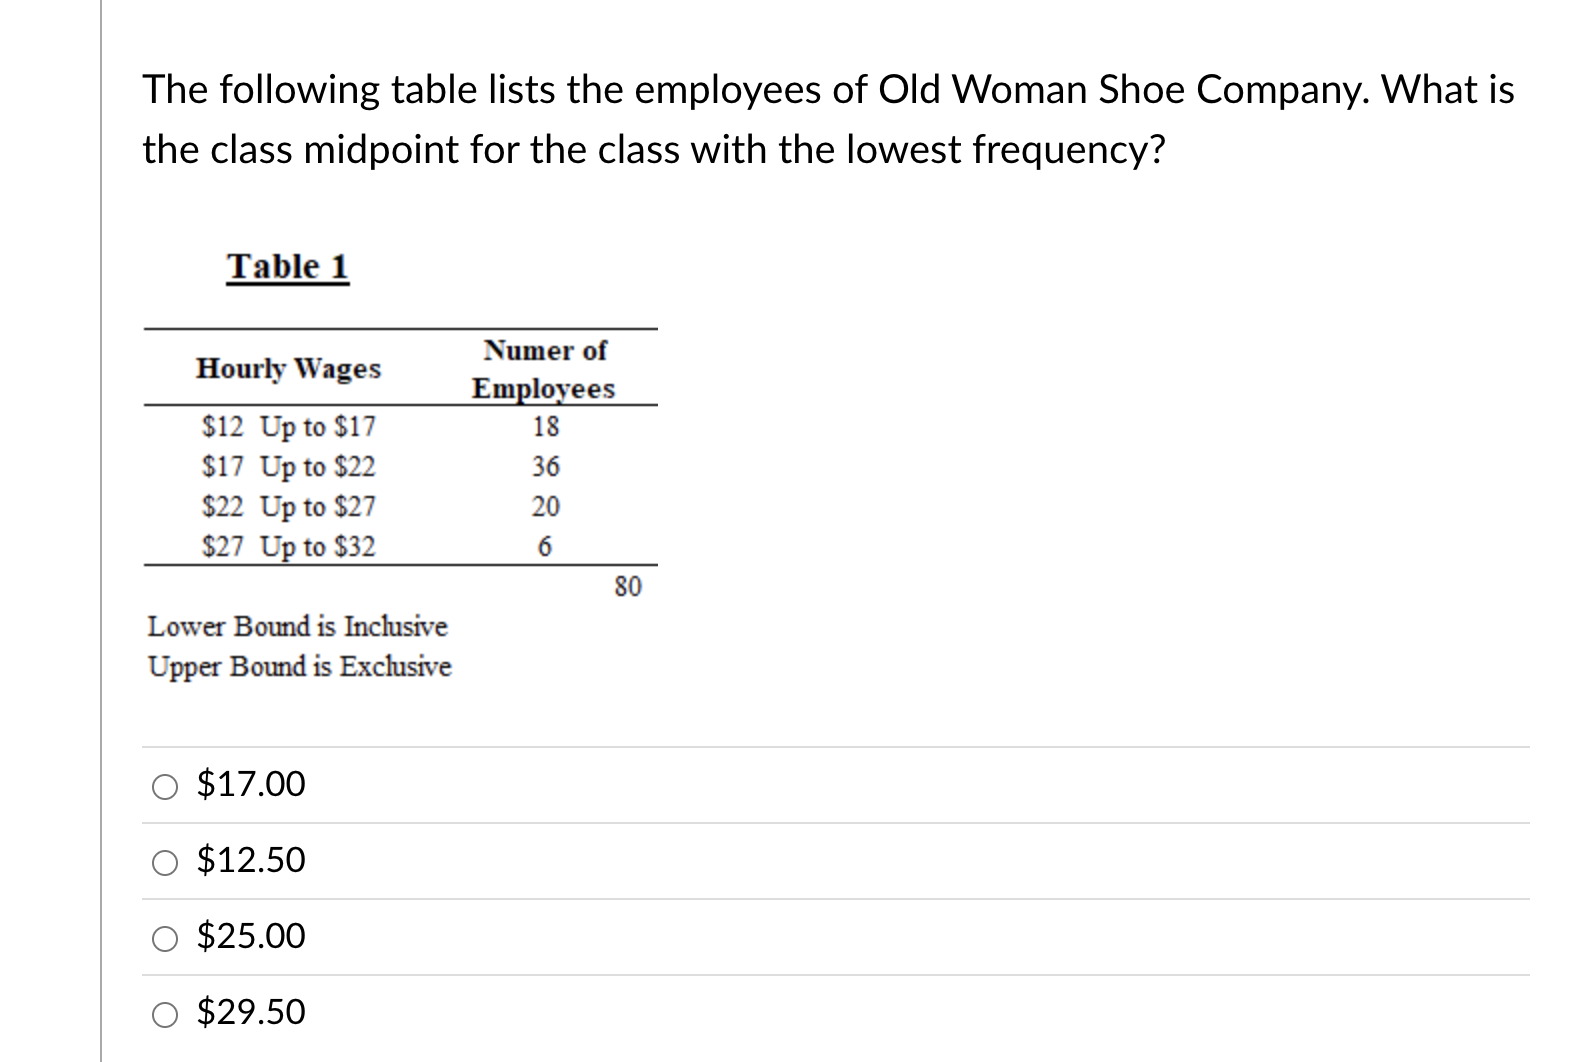
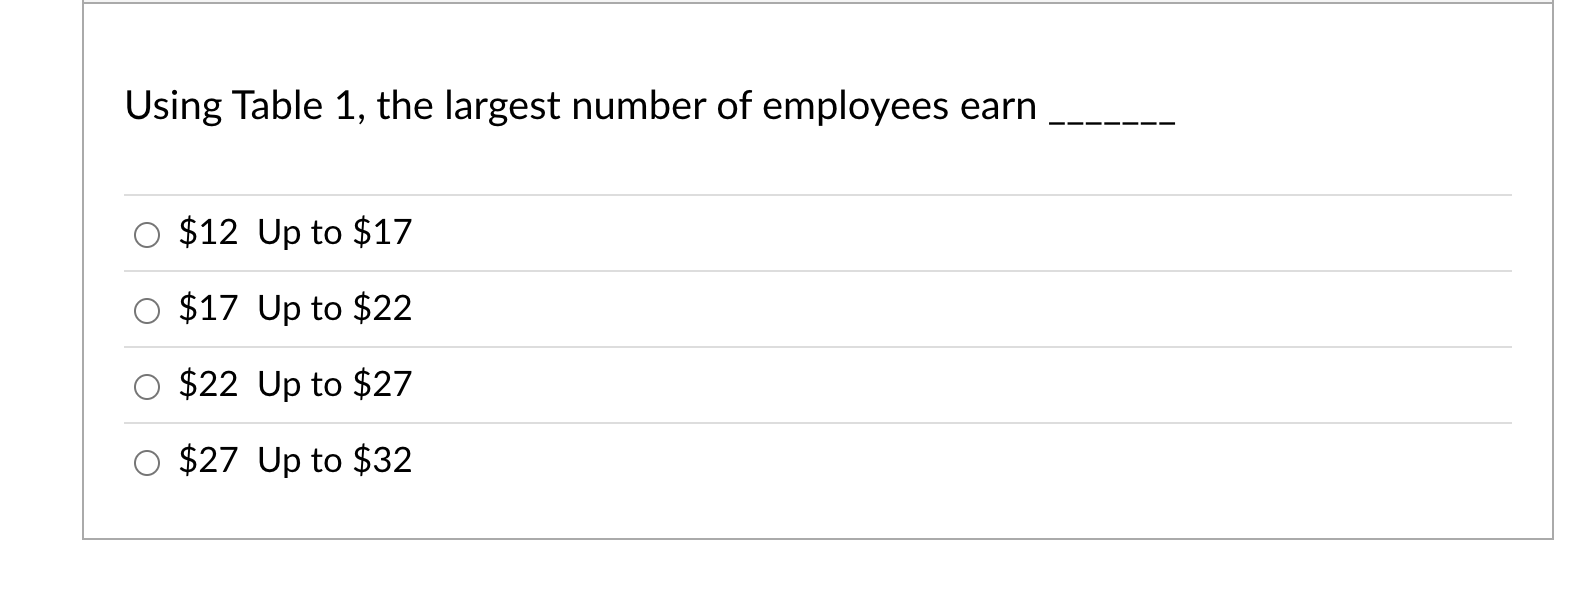

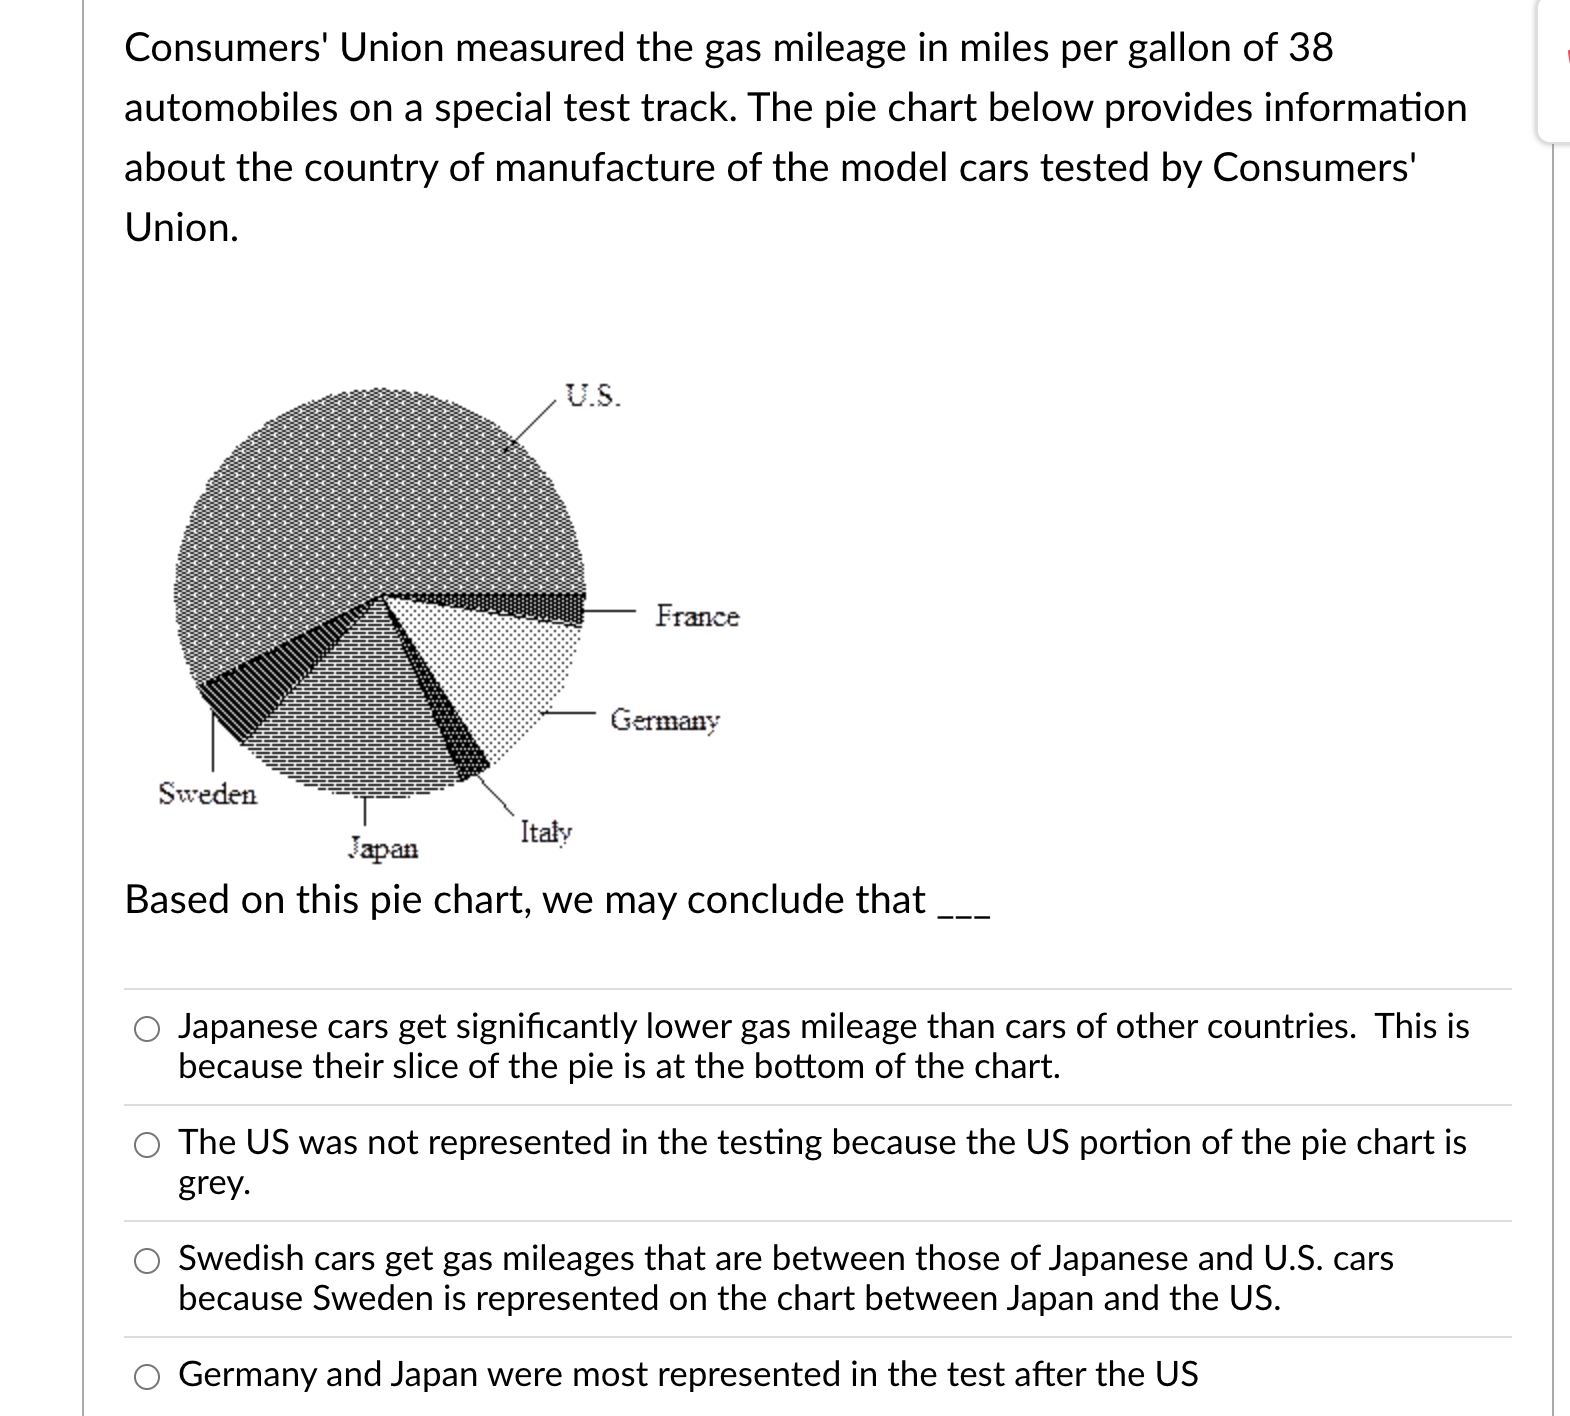
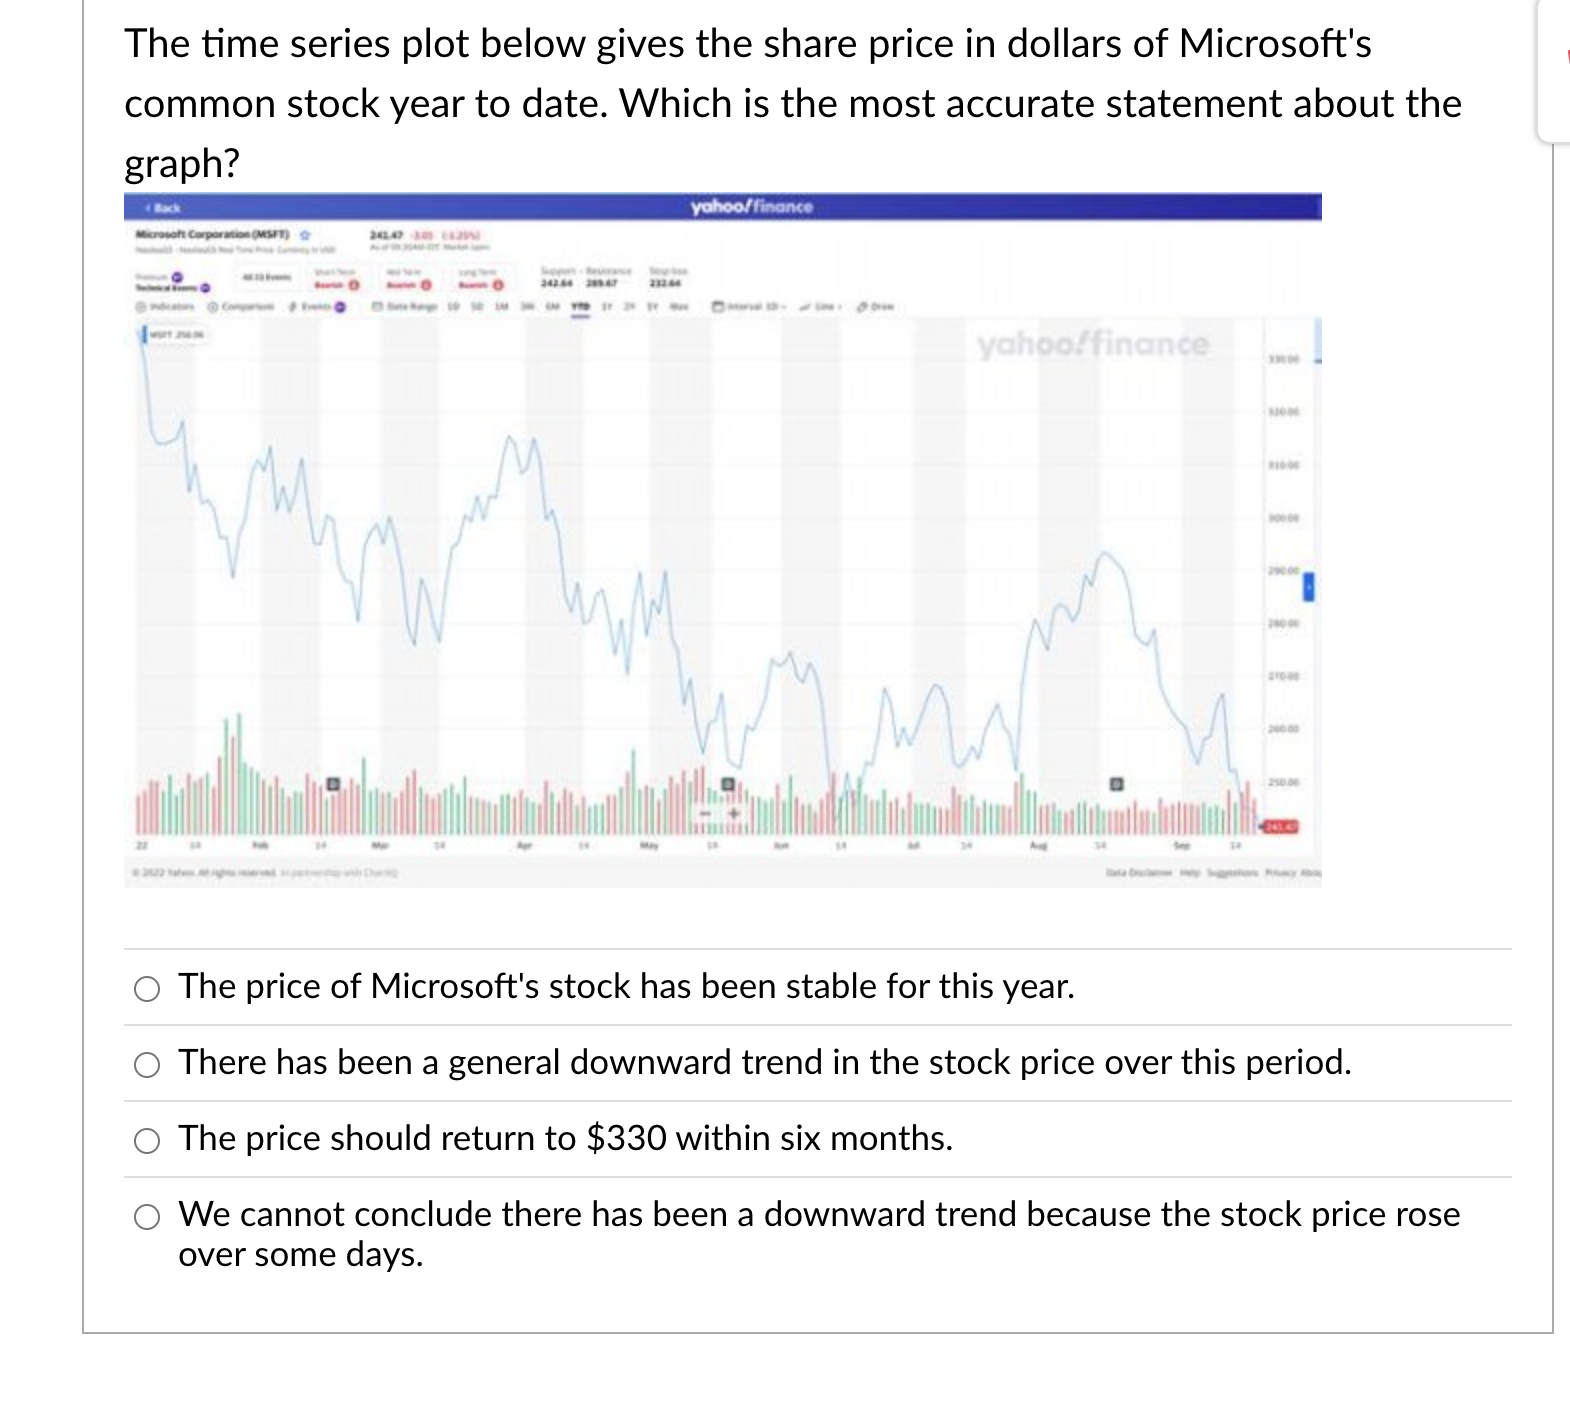
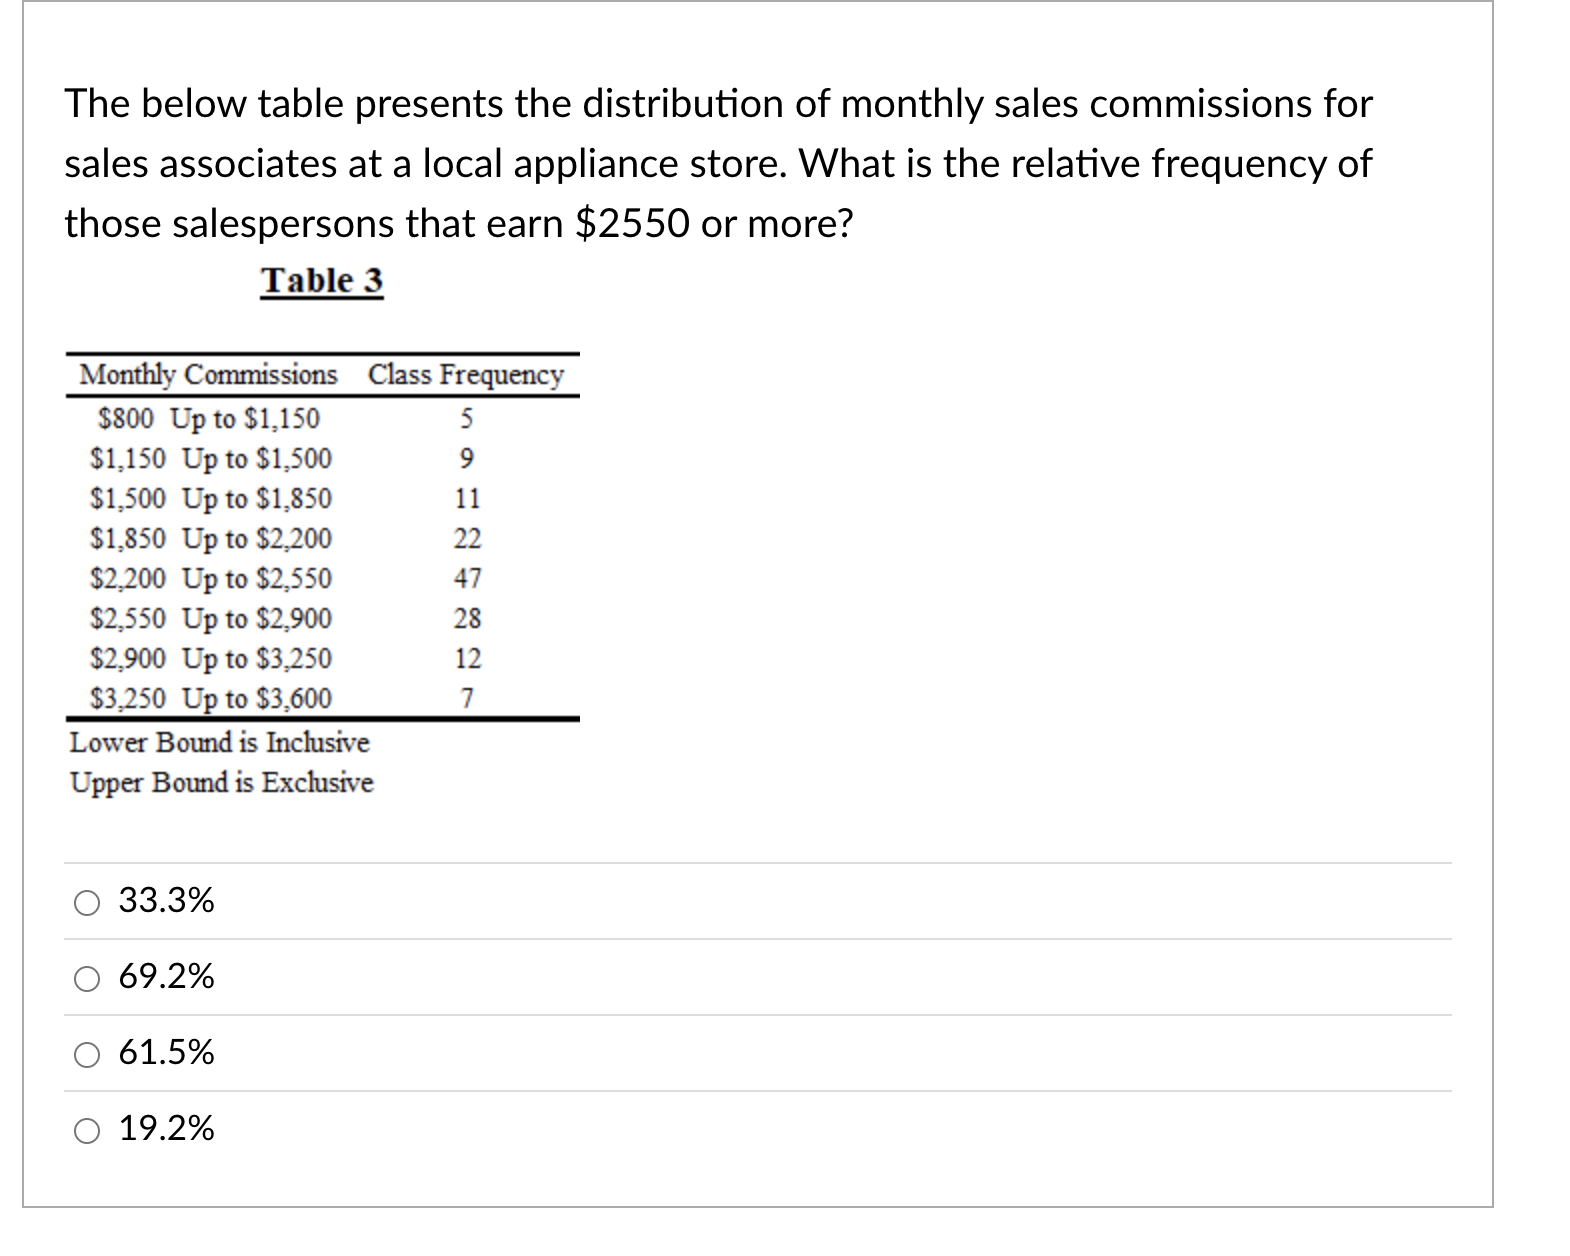
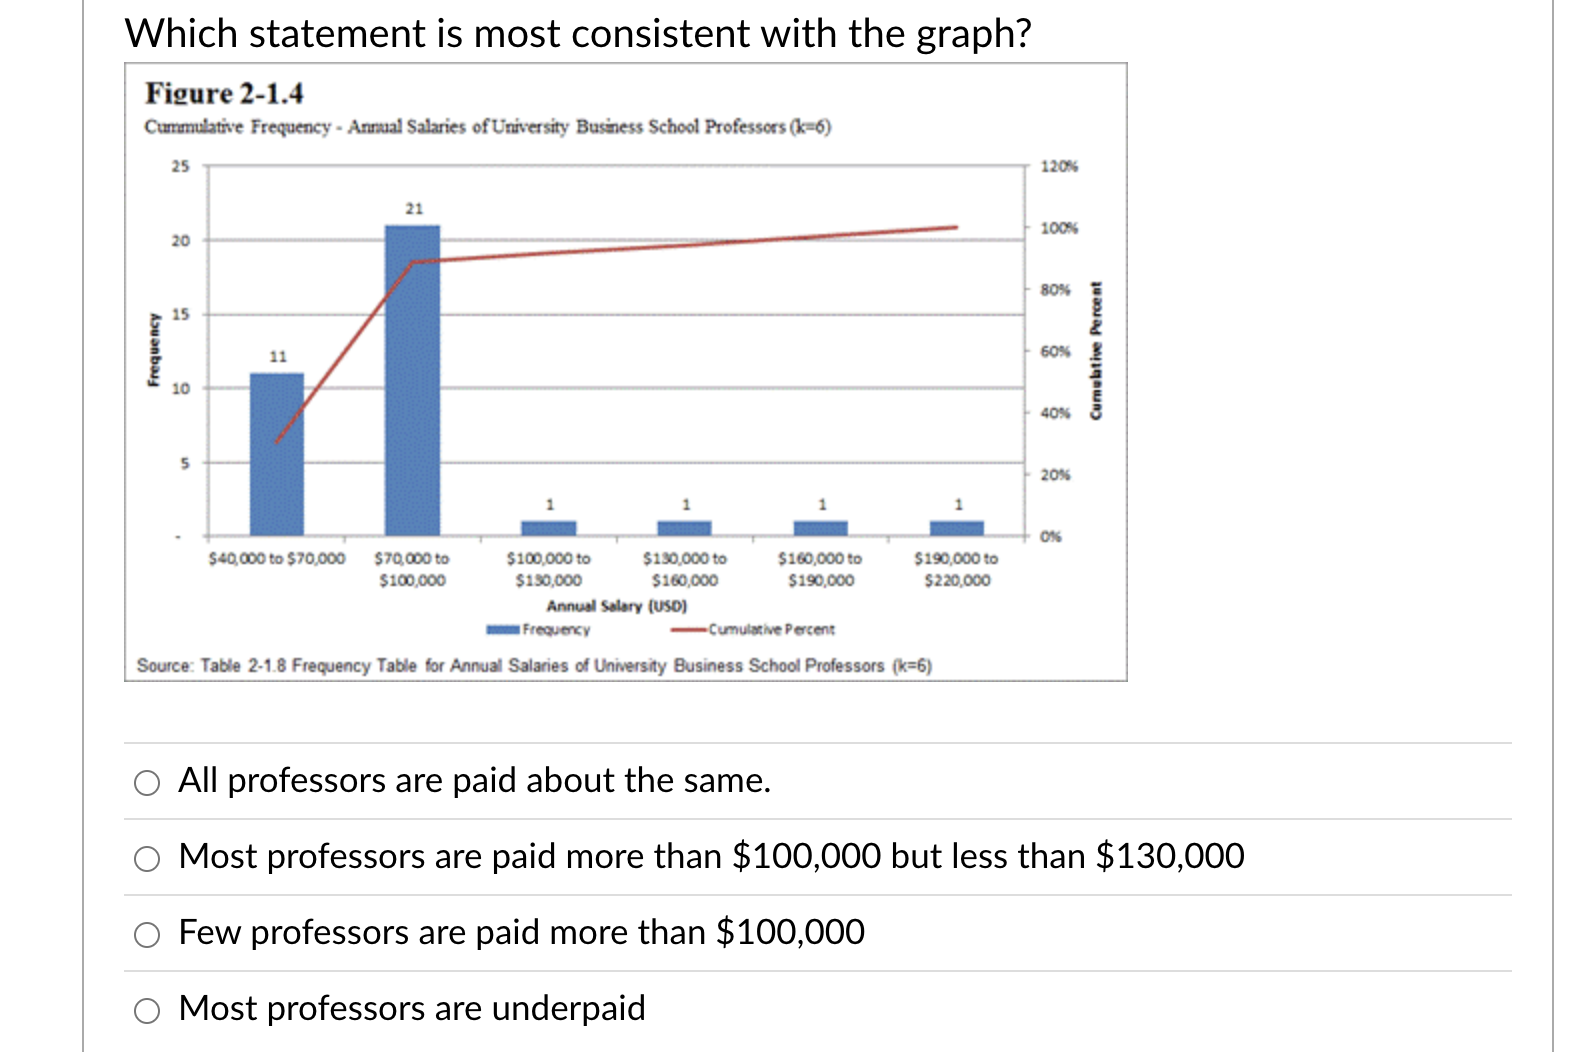
The following table lists the employees of Old Woman Shoe Company. What is the class midpoint for the class with the lowest frequency? Table 1 Numer of Hourly Wages Employees $12 Up to $17 18 $17 Up to $22 36 $22 Up to $27 20 $27 Up to $32 6 80 Lower Bound is Inclusive Upper Bound is Exclusive O $17.00 O $12.50 O $25.00 O $29.50Using Table 1, the largest number of employees earn _______ 0 $12 Up to $17 0 $17 Up to $22 0 $22 Up to $27 0 $27 Up to $32 Which statement is most consistent with the graph? Figure 2-1.4 Cummulative Frequency - Annual Salaries of University Business School Professors (k=6) 25 120% 21 100% 20 80%% 15 Cumulative Percent Frequency 11 60% 10 40% 5 20%% $40,000 to $70,000 $70,000 to $100,000 to $130,000 to $160,000 to $190,000 to $100,000 $130,000 $160,000 $190,000 $220,000 Annual Salary (USD) Frequency -Cumulative Percent Source: Table 2-1.8 Frequency Table for Annual Salaries of University Business School Professors (k=6) O All professors are paid about the same. O Most professors are paid more than $100,000 but less than $130,000 O Few professors are paid more than $100,000 O Most professors are underpaidConsumers' Union measured the gas mileage in miles per gallon of 38 automobiles on a special test track. The pie chart below provides information about the country of manufacture of the model cars tested by Consumers' Union. France G ermanj: Itahr Based on this pie chart, we may conclude that _ 0 Japanese cars get signicantly lower gas mileage than cars of other countries. This is because their slice of the pie is at the bottom of the chart. 0 The US was not represented in the testing because the US portion of the pie chart is grey. 0 Swedish cars get gas mileages that are between those of Japanese and U.S. cars because Sweden is represented on the chart between Japan and the US. 0 Germany and Japan were most represented in the test after the US The time series plot below gives the share price in dollars of Microsoft's common stock year to date. Which is the most accurate statement about the graph? nun-uh (-pu-n- an I O The price of Microsoft's stock has been stable for this year. Q There has been a general downward trend in the stock price over this period. 0 The price should return to $330 within six months. 0 We cannot conclude there has been a downward trend because the stock price rose over some days. \fThe below table presents the distribution of monthly sales commissions for sales associates at a local appliance store. What is the relative frequency of those salespersons that earn $2550 or more? Table 3 Monthly Commissions Class Frequency $800 Up to $1,150 5 $1,150 Up to $1,500 9 $1,500 Up to $1,850 11 $1,850 Up to $2,200 22 $2,200 Up to $2,550 47 $2,550 Up to $2,900 28 $2,900 Up to $3,250 12 $3,250 Up to $3,600 ? Lower Bound is Inclusive Upper Bound is Exclusive O 33.3% O 69.2% O 61.5% O 19.2%
Step by Step Solution
There are 3 Steps involved in it

Get step-by-step solutions from verified subject matter experts