

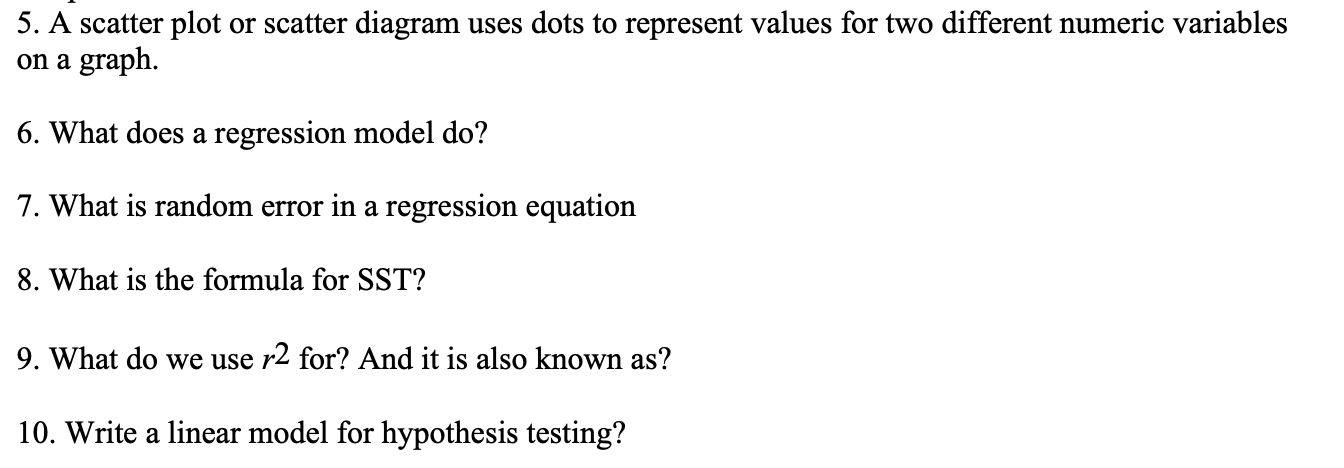
Question: 5. A scatter plot or scatter diagram uses dots to represent values for two different numeric variables on a graph. 6. What does a regression
Step by Step Solution
There are 3 Steps involved in it
1 Expert Approved Answer
Step: 1 Unlock

Question Has Been Solved by an Expert!
Get step-by-step solutions from verified subject matter experts
Step: 2 Unlock
Step: 3 Unlock