

Question: 5 AA 09-3 Global Analysis LO A1 Comparative figures for Samsung, Apple, and Google follow. In millions Net income Income taxes Interest expense Samsung Apple
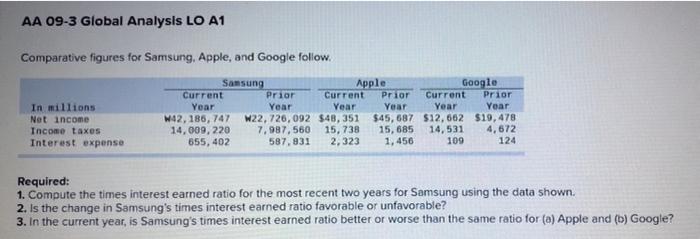
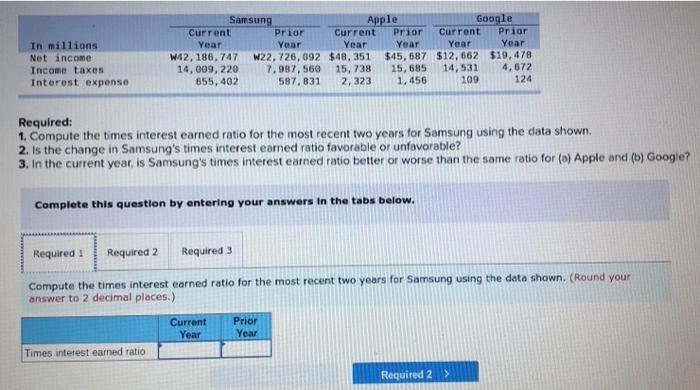
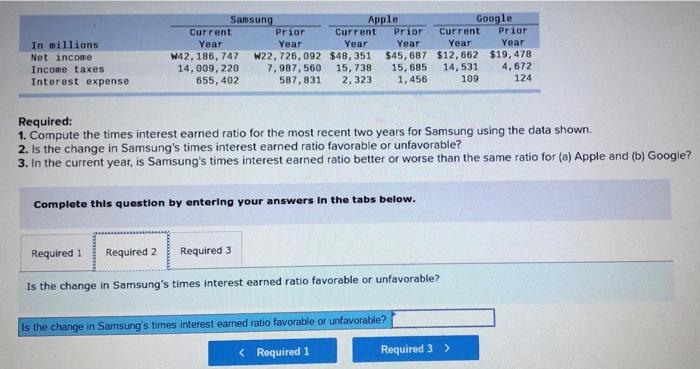
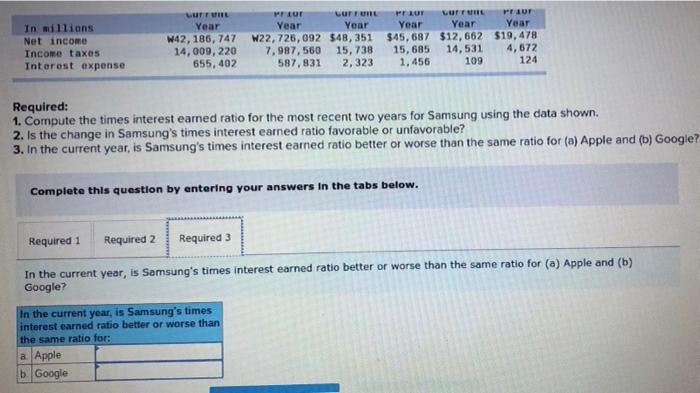
AA 09-3 Global Analysis LO A1 Comparative figures for Samsung, Apple, and Google follow. In millions Net income Income taxes Interest expense Samsung Apple Google Current Prior Current Prior Current Prior Year Year Year Year Year Year 142, 186, 747 W22, 726,092 $48,351 $45, 687 $12,662 $19,478 14,009, 220 7,987,560 15,738 15,685 14,531 4,672 655, 402 587.831 2,323 1,456 109 124 Required: 1. Compute the times interest earned ratio for the most recent two years for Samsung using the data shown. 2. Is the change in Samsung's times interest earned ratio favorable or unfavorable? 3. In the current year, is Samsung's times interest earned ratio better or worse than the same ratio for (a) Apple and (b) Google? In millions Net income Income taxes Interest expense Samsung Apple Google Current Prior Current Prior Current Prior Year Year Year Year Year Year W42, 186, 747 W22, 726,092 $48,351 $45,687 $12,662 $19,478 14,009, 220 7,987, 560 15,738 15,685 14,531 4,672 655, 402 587,831 2,323 1.456 109 124 Required: 1. Compute the times interest earned ratio for the most recent two years for Samsung using the data shown. 2. Is the change in Samsung's times interest earned ratio favorable or unfavorable? 3. In the current year, is Samsung's times interest earned ratio better or worse than the same ratio for (0) Apple and (b) Google? Complete this question by entering your answers in the tabs below. Required: Required 2 Required 3 Compute the times interest earned ratio for the most recent two years for Samsung using the data shown. (Round your answer to 2 decimal places.) Current Year Prior Year Times interest earned ratio Required 2 > In millions Net income Income taxes Interest expense Samsung Apple Google Current Prior Current Prior Current Prior Year Year Year Year Year Year W42, 186, 747 W22, 726,092 $48, 351 $45, 687 $12,662 $19,478 14,009, 220 7,987,560 15,738 15,685 14,531 4,672 655, 402 587,831 2, 323 1,456 109 124 Required: 1. Compute the times interest earned ratio for the most recent two years for Samsung using the data shown. 2. Is the change in Samsung's times interest earned ratio favorable or unfavorable? 3. In the current year, is Samsung's times interest earned ratio better or worse than the same ratio for (a) Apple and (b) Google? Complete this question by entering your answers in the tabs below. Required 1 Required 2 Required 3 Is the change in Samsung's times interest earned ratio favorable or unfavorable? Is the change in Samsung's times interest earned ratio favorable or unfavorable? LUFF Year In millions Net income Income taxes Interest expense W42, 186, 747 14,009, 220 655, 402 Ur CUTTUR PELUR curu PRAUT Year Year Year Year Year W22, 726,092 $48,351 $45,687 $12,662 $19,478 7.987,560 15,738 15,685 14,531 4,672 587,831 2.323 1,456 109 124 Required: 1. Compute the times interest earned ratio for the most recent two years for Samsung using the data shown. 2. Is the change in Samsung's times interest earned ratio favorable or unfavorable? 3. In the current year, is Samsung's times interest earned ratio better or worse than the same ratio for (a) Apple and (b) Google? Complete this question by entering your answers in the tabs below. Required 1 Required 2 Required 3 In the current year, is Samsung's times interest earned ratio better or worse than the same ratio for (a) Apple and (b) Google? In the current year, is Samsung's times interest earned ratio better or worse than the same ratio for: a Apple b. Google
Step by Step Solution
There are 3 Steps involved in it

Get step-by-step solutions from verified subject matter experts