

Question: Help 5 AA 8-3 Global Analysis LO A1 Comparative figures for Samsung, Apple, and Google follow. Ded In millions Total assets Net sales Current Year
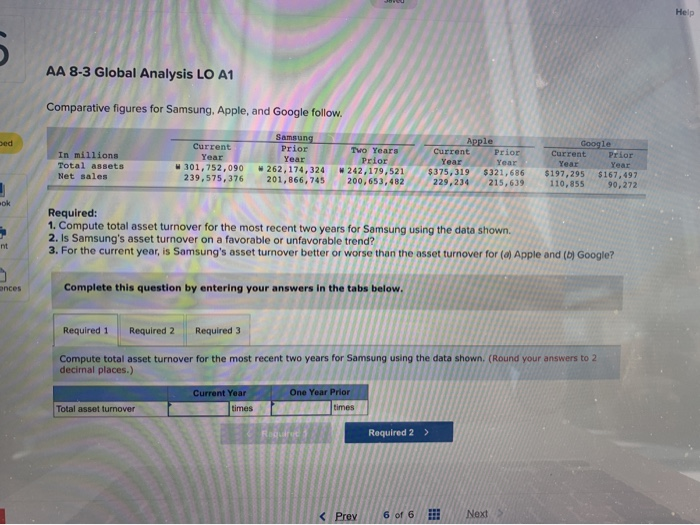
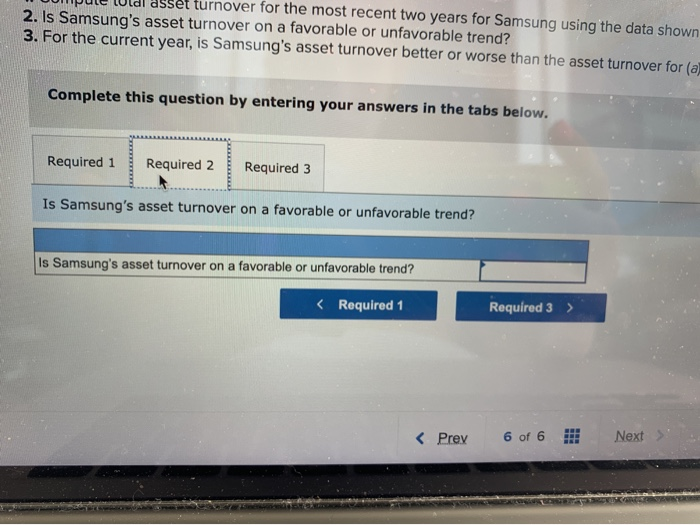
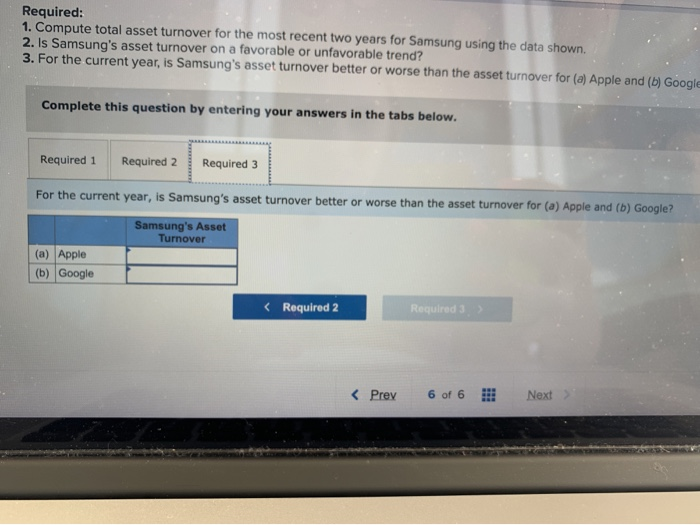
Help 5 AA 8-3 Global Analysis LO A1 Comparative figures for Samsung, Apple, and Google follow. Ded In millions Total assets Net sales Current Year W 301,752,090 239,575,376 Samsung Prior Year w 262,174,324 201,866, 745 Two Years Prior W 242,179,521 200,653,482 Apple Current Prior Year Year $375,319 $321,686 229,234 215,639 Google Current Prior Year Year $197, 295 $167,497 110,855 90,272 ok Required: 1. Compute total asset turnover for the most recent two years for Samsung using the data shown. 2. Is Samsung's asset turnover on a favorable or unfavorable trend? 3. For the current year, is Samsung's asset turnover better or worse than the asset turnover for (a) Apple and (b) Google? nt ances Complete this question by entering your answers in the tabs below. Required 1 Required 2 Required 3 Compute total asset turnover for the most recent two years for Samsung using the data shown. (Round your answers to 2 decimal places.) Current Year One Year Prior times Total asset turnover times Rogurt Required 2 >
Step by Step Solution
There are 3 Steps involved in it

Get step-by-step solutions from verified subject matter experts