

Question: 5. (A*.m script file is required for this question) In Matlab, calculate the following equation and then plot a graph for Y vs. X. You
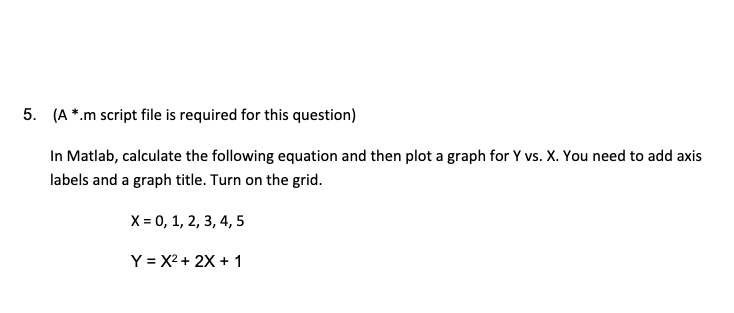
5. (A*.m script file is required for this question) In Matlab, calculate the following equation and then plot a graph for Y vs. X. You need to add axis labels and a graph title. Turn on the grid. X=0,1,2,3,4,5Y=X2+2X+1 Select variables to import using checkboxes Create variables matching preview. Create vectors from each column using column names. Create vectors from each row using row names
Step by Step Solution
There are 3 Steps involved in it
1 Expert Approved Answer
Step: 1 Unlock

Question Has Been Solved by an Expert!
Get step-by-step solutions from verified subject matter experts
Step: 2 Unlock
Step: 3 Unlock