

Question: please show how to solve using matlab Problem 1 The energy needed to heat a liquid from one temperature to another temperature, at constant pressure
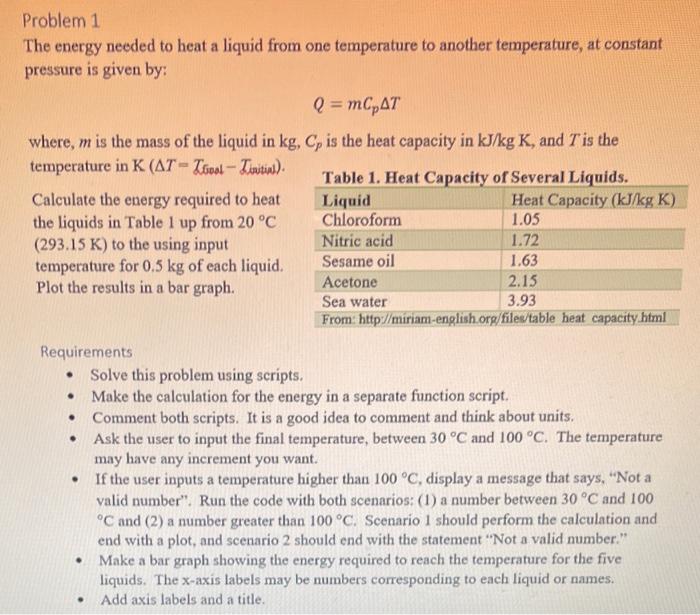
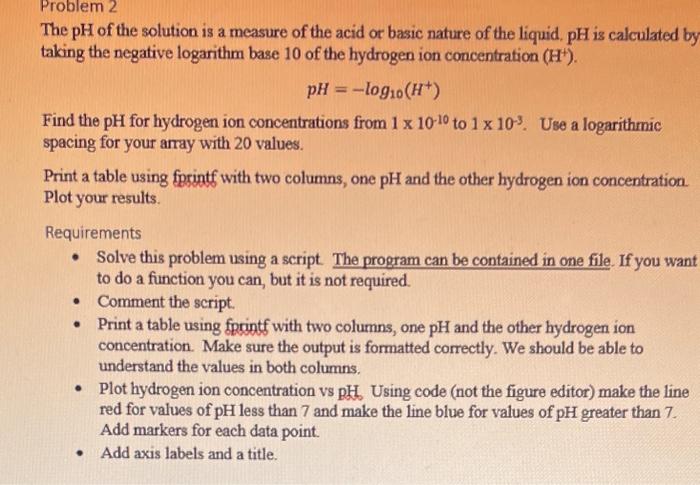
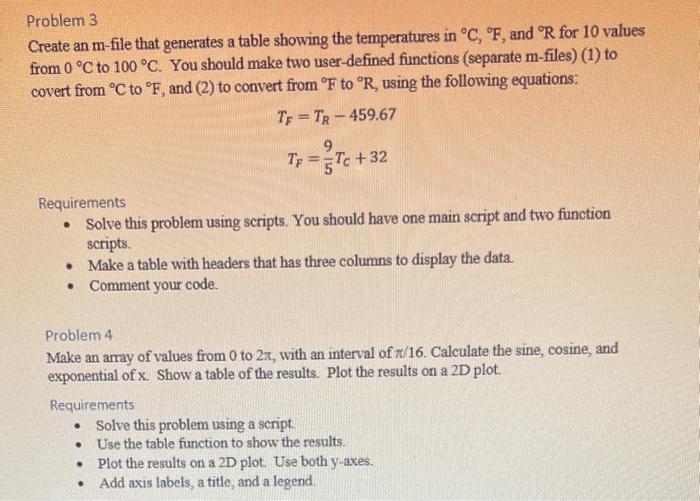
Problem 1 The energy needed to heat a liquid from one temperature to another temperature, at constant pressure is given by: Q=mCpT where, m is the mass of the liquid in kg,Cp is the heat capacity in kJ/kgK, and T is the temperature in K(T=TtioolTinitian). Calculate the energy required to heat the liquids in Table 1 up from 20C (293.15 K ) to the using input temperature for 0.5kg of each liquid. Plot the results in a bar graph. Requirements - Solve this problem using scripts. - Make the calculation for the energy in a separate function script. - Comment both scripts. It is a good idea to comment and think about units. - Ask the user to input the final temperature, between 30C and 100C. The temperature may have any increment you want. - If the user inputs a temperature higher than 100C, display a message that says, "Not a valid number". Run the code with both scenarios: (1) a number between 30C and 100 C and (2) a number greater than 100C. Scenario 1 should perform the calculation and end with a plot, and scenario 2 should end with the statement "Not a valid number." - Make a bar graph showing the energy required to reach the temperature for the five liquids. The x-axis labels may be numbers corresponding to each liquid or names. - Add axis labels and a title. The pH of the solution is a measure of the acid or basic nature of the liquid. pH is calculated by taking the negative logarithm base 10 of the hydrogen ion concentration (H+). pH=log10(H+) Find the pH for hydrogen ion concentrations from 11010 to 1103. Use a logarithmic spacing for your array with 20 values. Print a table using fprintf with two columns, one pH and the other hydrogen ion concentration. Plot your results. Requirements - Solve this problem using a script. The program can be contained in one file. If you want to do a function you can, but it is not required. - Comment the script. - Print a table using fprintf with two columns, one pH and the other hydrogen ion concentration. Make sure the output is formatted correctly. We should be able to understand the values in both columns. - Plot hydrogen ion concentration vs pH0 Using code (not the figure editor) make the line red for values of pH less than 7 and make the line blue for values of pH greater than 7 . Add markers for each data point. - Add axis labels and a title. Problem 3 Create an m-file that generates a table showing the temperatures in C,F, and R for 10 values from 0C to 100C. You should make two user-defined functions (separate m-files) (1) to covert from C to F, and (2) to convert from F to R, using the following equations: TF=TR459.67TF=59TC+32 Requirements - Solve this problem using scripts. You should have one main script and two function scripts. - Make a table with headers that has three columns to display the data. - Comment your code. Problem 4 Make an array of values from 0 to 2, with an interval of /16. Calculate the sine, cosine, and exponential of x. Show a table of the results. Plot the results on a 2D plot. Requirements - Solve this problem using a script. - Use the table function to show the results. - Plot the results on a 2D plot. Use both y-axes. - Add axis labels, a title, and a legend
Step by Step Solution
There are 3 Steps involved in it

Get step-by-step solutions from verified subject matter experts