

Question: 5. Based on the following relationship matrix, compute the importance weights. 2 PART | Competing on Quality 6. Identify causes of a steady increase of
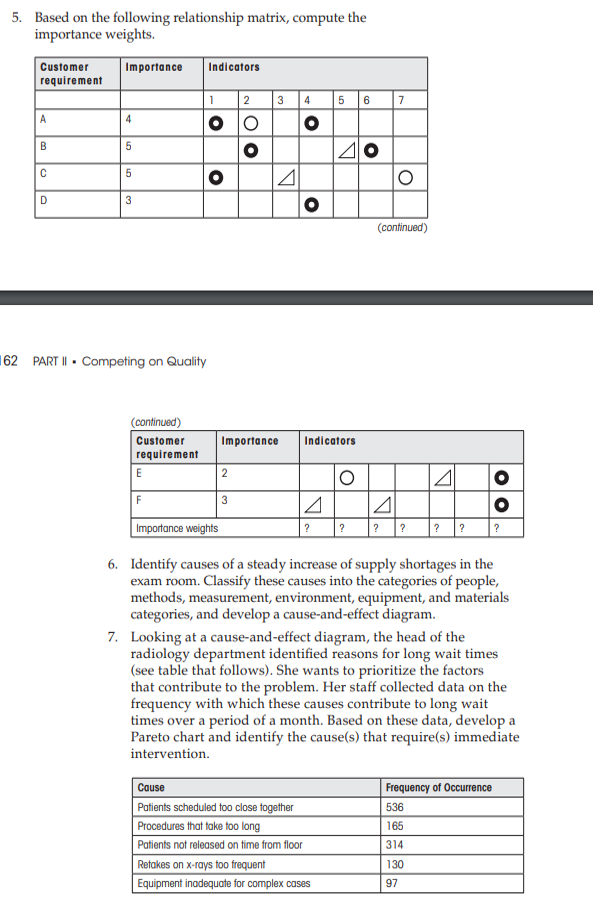
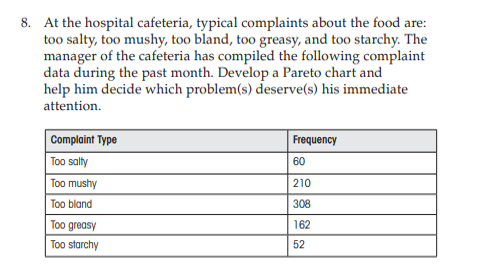
5. Based on the following relationship matrix, compute the importance weights. 2 PART \| Competing on Quality 6. Identify causes of a steady increase of supply shortages in the exam room. Classify these causes into the categories of people, methods, measurement, environment, equipment, and materials categories, and develop a cause-and-effect diagram. 7. Looking at a cause-and-effect diagram, the head of the radiology department identified reasons for long wait times (see table that follows). She wants to prioritize the factors that contribute to the problem. Her staff collected data on the frequency with which these causes contribute to long wait times over a period of a month. Based on these data, develop a Pareto chart and identify the cause(s) that require(s) immediate intervention. At the hospital cafeteria, typical complaints about the food are: too salty, too mushy, too bland, too greasy, and too starchy. The manager of the cafeteria has compiled the following complaint data during the past month. Develop a Pareto chart and help him decide which problem(s) deserve(s) his immediate attention
Step by Step Solution
There are 3 Steps involved in it

Get step-by-step solutions from verified subject matter experts