

Question: 5. Below is presented a table of data for cost of goods sold and ending inventory for the first six months of 2011 for EBCO,
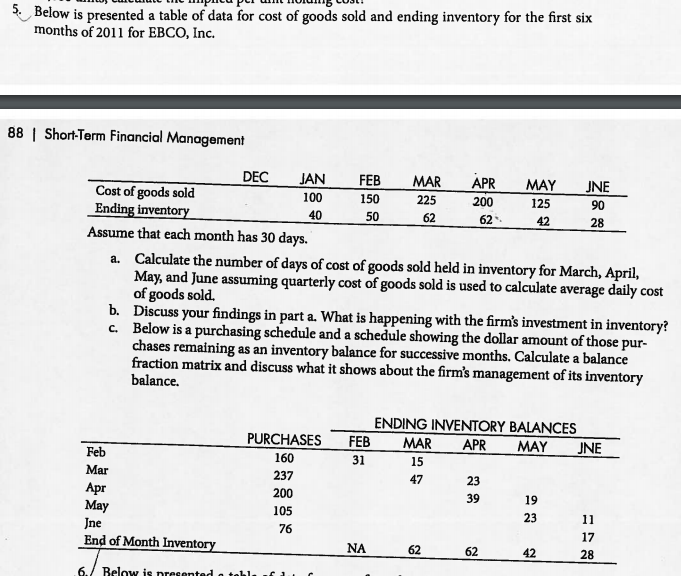
5. Below is presented a table of data for cost of goods sold and ending inventory for the first six months of 2011 for EBCO, Inc. 88 | Short-Term Financial Management 150 100 40 MAR 225 62 90 28 42 DEC JAN FEB APR MAY JNE Cost of goods sold 200 125 Ending inventory 50 62 Assume that each month has 30 days. a. Calculate the number of days of cost of goods sold held in inventory for March, April, May, and June assuming quarterly cost of goods sold is used to calculate average daily cost of goods sold. b. Discuss your findings in part a. What is happening with the firm's investment in inventory? c. Below is a purchasing schedule and a schedule showing the dollar amount of those pur- chases remaining as an inventory balance for successive months. Calculate a balance fraction matrix and discuss what it shows about the firm's management of its inventory balance. Feb Mar Apr May Jne End of Month Inventory PURCHASES 160 237 200 105 76 ENDING INVENTORY BALANCES FEB MAR APR MAY JNE 31 15 47 23 39 19 23 11 17 NA 62 62 42 28 6. Below is presented
Step by Step Solution
There are 3 Steps involved in it

Get step-by-step solutions from verified subject matter experts