

Question: 6. Below is presented a table of data for cost of goods sold and ending inventory for the first six months of 2012 for Wynn
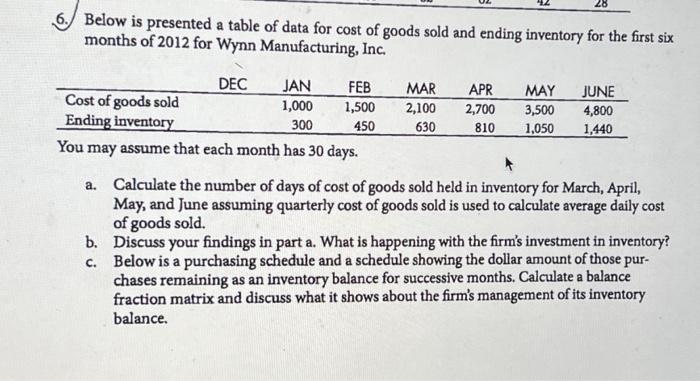
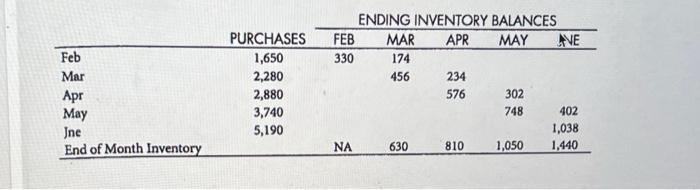
6. Below is presented a table of data for cost of goods sold and ending inventory for the first six months of 2012 for Wynn Manufacturing, Inc. You may assume that each month has 30 days. a. Calculate the number of days of cost of goods sold held in inventory for March, April, May, and June assuming quarterly cost of goods sold is used to calculate average daily cost of goods sold. b. Discuss your findings in part a. What is happening with the firm's investment in inventory? c. Below is a purchasing schedule and a schedule showing the dollar amount of those purchases remaining as an inventory balance for successive months. Calculate a balance fraction matrix and discuss what it shows about the firm's management of its inventory balance. ENDING INVENTORY BALANCES \begin{tabular}{lcccccc} & & \multicolumn{5}{c}{} \\ \cline { 3 - 7 } & PURCHASES & FEB & MAR & APR & MAY & AVE \\ \hline Feb & 1,650 & 330 & 174 & & & \\ Mar & 2,280 & & 456 & 234 & & \\ Apr & 2,880 & & & 576 & 302 & \\ May & 3,740 & & & & 748 & 402 \\ Jne & 5,190 & & & & & 1,038 \\ End of Month Inventory & & NA & 630 & 810 & 1,050 & 1,440 \\ \hline \end{tabular} 6. Below is presented a table of data for cost of goods sold and ending inventory for the first six months of 2012 for Wynn Manufacturing, Inc. You may assume that each month has 30 days. a. Calculate the number of days of cost of goods sold held in inventory for March, April, May, and June assuming quarterly cost of goods sold is used to calculate average daily cost of goods sold. b. Discuss your findings in part a. What is happening with the firm's investment in inventory? c. Below is a purchasing schedule and a schedule showing the dollar amount of those purchases remaining as an inventory balance for successive months. Calculate a balance fraction matrix and discuss what it shows about the firm's management of its inventory balance. ENDING INVENTORY BALANCES \begin{tabular}{lcccccc} & & \multicolumn{5}{c}{} \\ \cline { 3 - 7 } & PURCHASES & FEB & MAR & APR & MAY & AVE \\ \hline Feb & 1,650 & 330 & 174 & & & \\ Mar & 2,280 & & 456 & 234 & & \\ Apr & 2,880 & & & 576 & 302 & \\ May & 3,740 & & & & 748 & 402 \\ Jne & 5,190 & & & & & 1,038 \\ End of Month Inventory & & NA & 630 & 810 & 1,050 & 1,440 \\ \hline \end{tabular}
Step by Step Solution
There are 3 Steps involved in it

Get step-by-step solutions from verified subject matter experts