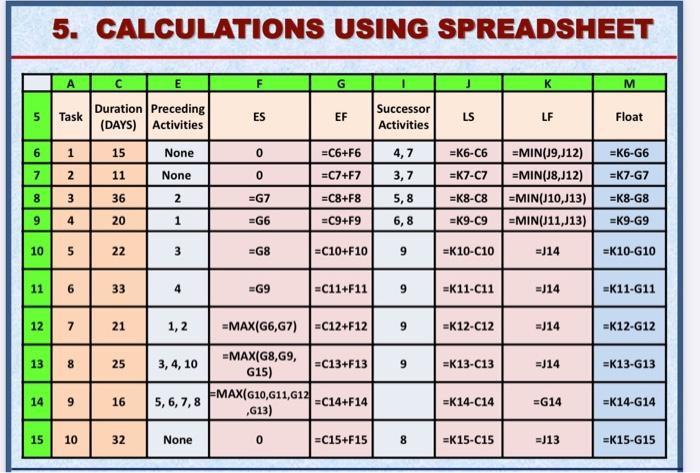
Question: 5. CALCULATIONS USING SPREADSHEET E F G M 5 Task Duration Preceding (DAYS) Activities ES EF Successor Activities LS LF Float 6 1 15 None

5. CALCULATIONS USING SPREADSHEET E F G M 5 Task
5. CALCULATIONS USING SPREADSHEET E F G M 5 Task Duration Preceding (DAYS) Activities ES EF Successor Activities LS LF Float 6 1 15 None 0 =C6+F6 4,7 =k6-C6 =K6-G6 7 11 None 0 =C7+F7 3,7 =K7-C7 =K7-G7 wN =MIN(19,12) =MIN(18,J12) =MIN(J10,113) =MIN(J11,J13) 00 36 2 =G7 =C8+F8 5,8 =K8-C8 =K8-G8 9 4 20 1 =G6 =C9+F9 6,8 =K9-09 =K9-G9 10 5 22 3 =G8 =C10+F10 9 =K10-010 =)14 =K10-610 11 6 33 4 G9 =C11+F11 9 =K11-C11 =J14 =K11-11 12 7 21 1,2 =MAX(G6,G7) -C12+F12 9 =K12-C12 =J14 =K12-G12 13 8 25 3, 4, 10 9 =K13-C13 =J14 =K13-G13 =MAX(G8,69, =C13+F13 G15) EMAX(G10,611,412 =C14+F14 ,613) 14 9 16 5, 6, 7, 8 =K14-C14 =G14 =K14-G14 15 10 32 None 0 EC15+F15 8 =K15-C15 =J13 =K15-G15 5.1 Assignment For the project given in the previous slide: 1) Draw the AON diagram for the project. In the diagram all calculations for ES, EF, LS and LF should be performed 2) Calculate the total and free float for each activity and determine the critical path. 3) Re-perform all calculations using a spread sheet (MS Excel) and compare the calculations resulted from the AON diagram. 4) Draw a Gaunt Chart for the project plan (Activities versus Time)

Step by Step Solution

There are 3 Steps involved in it

1 Expert Approved Answer
Step: 1 Unlock blur-text-image
Question Has Been Solved by an Expert!

Get step-by-step solutions from verified subject matter experts

Step: 2 Unlock
Step: 3 Unlock

Students Have Also Explored These Related General Management Questions!