

Question: 5. Complete the table below. 6. Graph the residuals on the axes Year Actual Predicted Residual below. This is called a residual plot. Units Sold
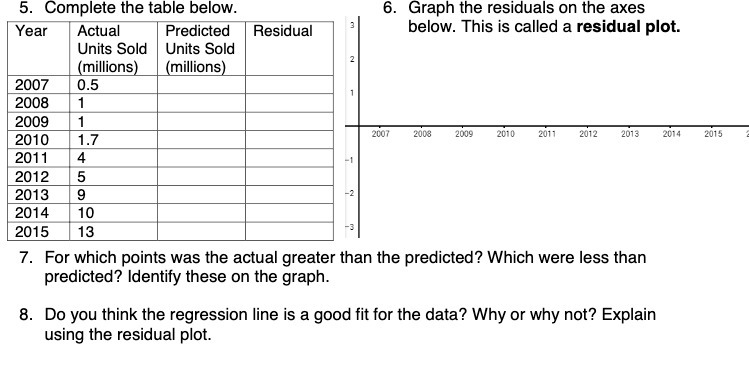
5. Complete the table below. 6. Graph the residuals on the axes Year Actual Predicted Residual below. This is called a residual plot. Units Sold Units Sold (millions) (millions) 2 2007 0.5 2008 1 7 2009 2010 1.7 2007 2008 2009 2010 2011 2012 2013 2014 2015 2011 4 -1 2012 5 2013 CO -2 2014 10 2015 13 7. For which points was the actual greater than the predicted? Which were less than predicted? Identify these on the graph. 8. Do you think the regression line is a good fit for the data? Why or why not? Explain using the residual plot
Step by Step Solution
There are 3 Steps involved in it
1 Expert Approved Answer
Step: 1 Unlock

Question Has Been Solved by an Expert!
Get step-by-step solutions from verified subject matter experts
Step: 2 Unlock
Step: 3 Unlock