

Question: 5. Construct the confidence interval for the population mean u. c = 0.98, x = 15.1, 6=9.0, and n = 90 . . . A
5.
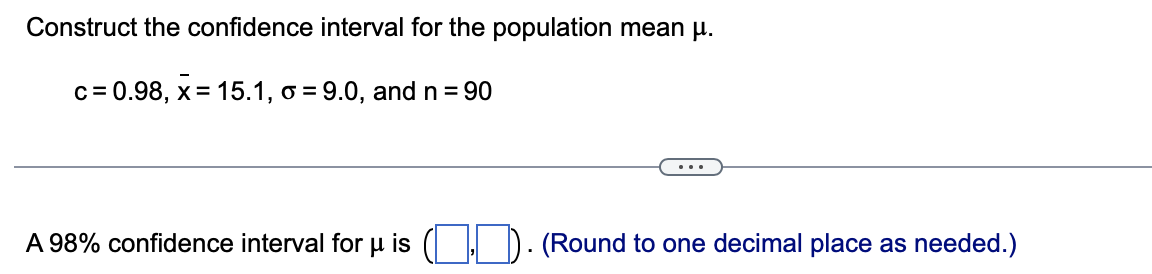
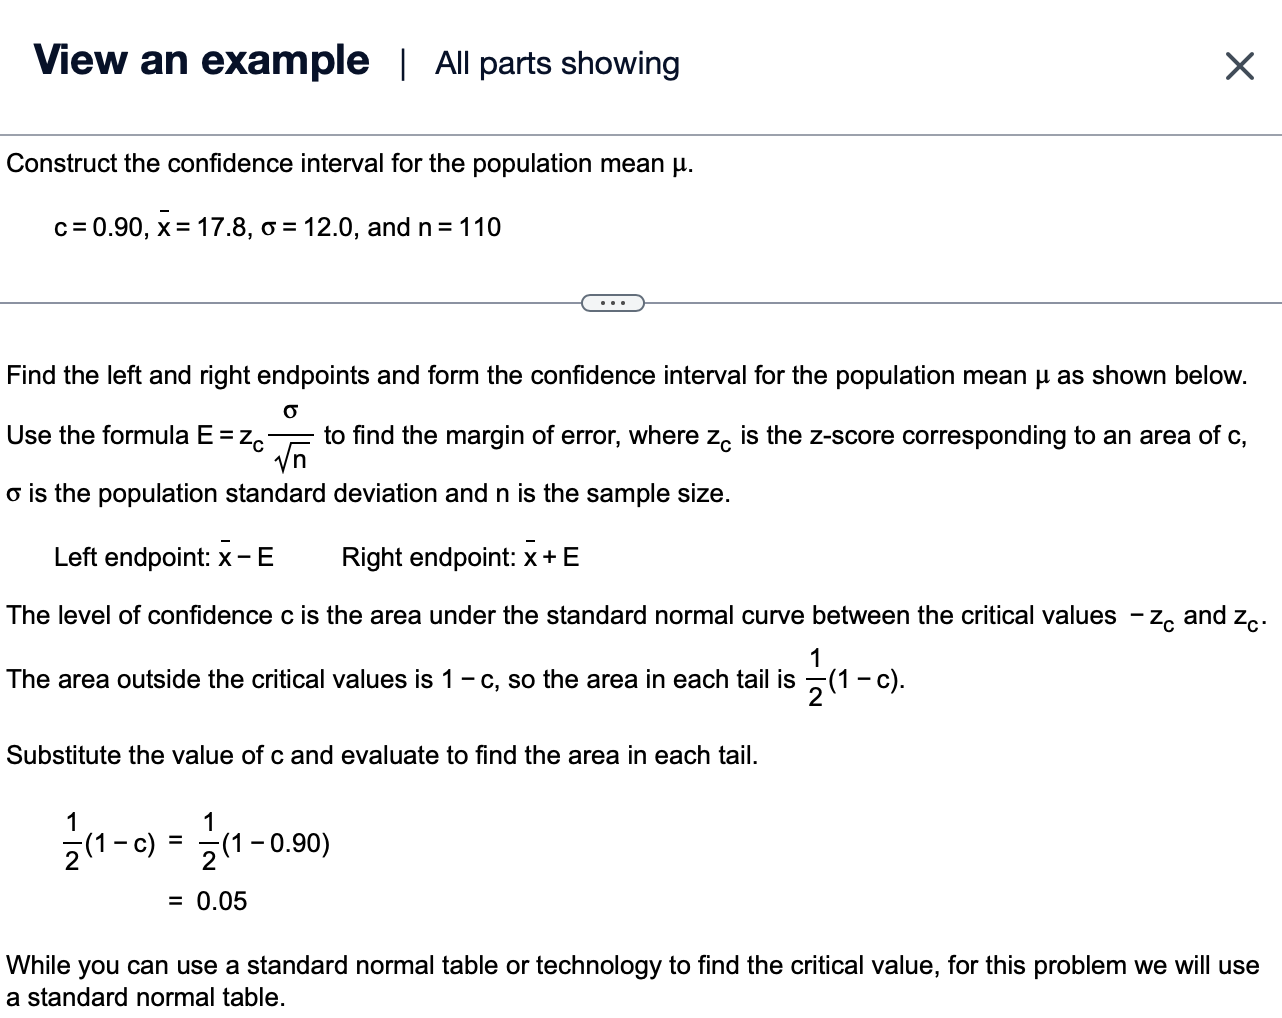
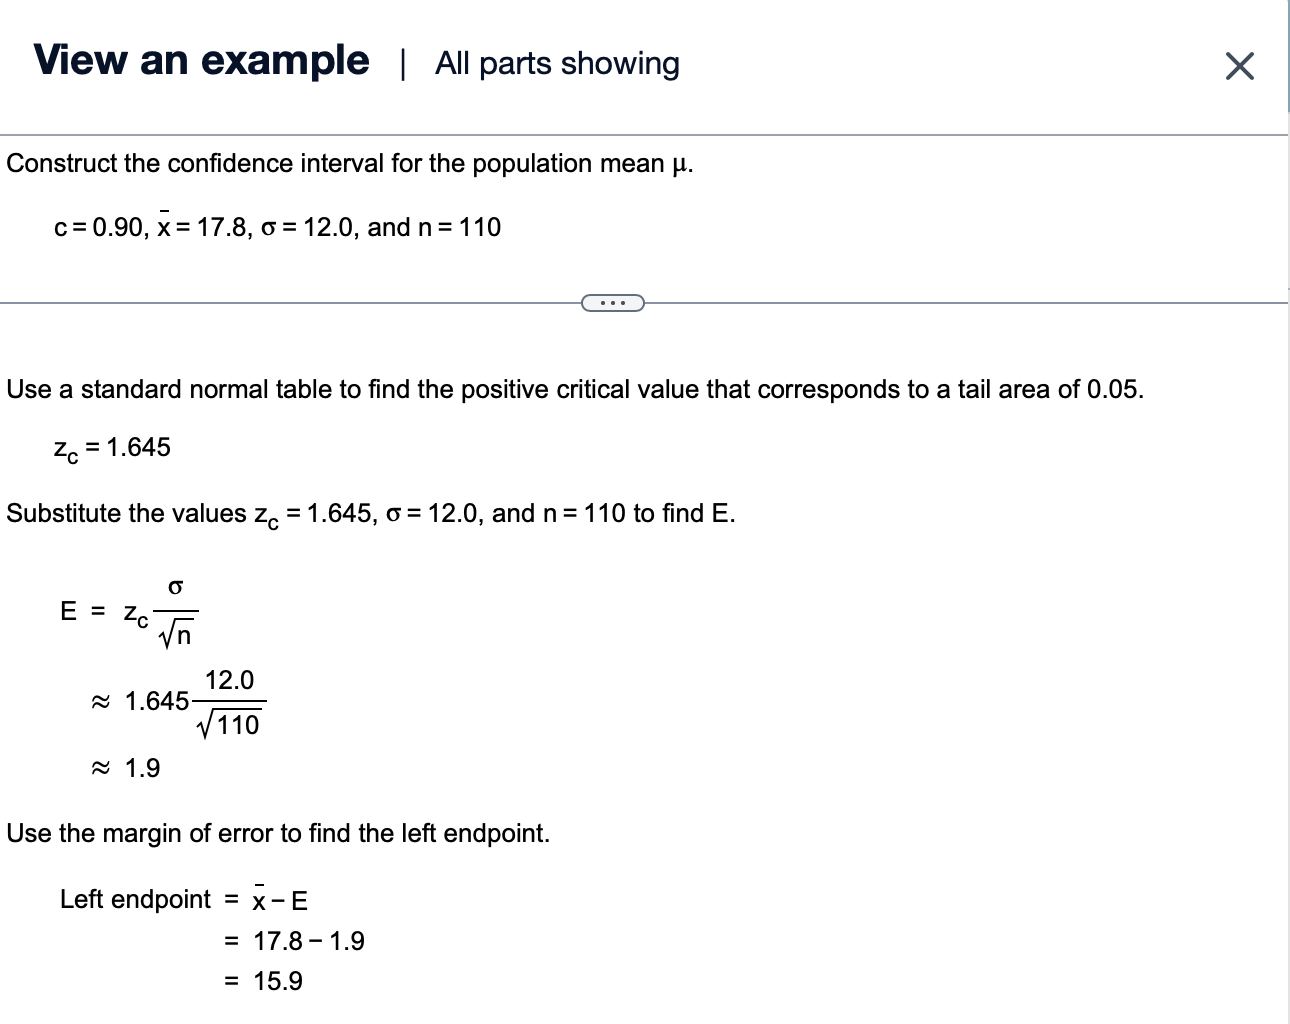
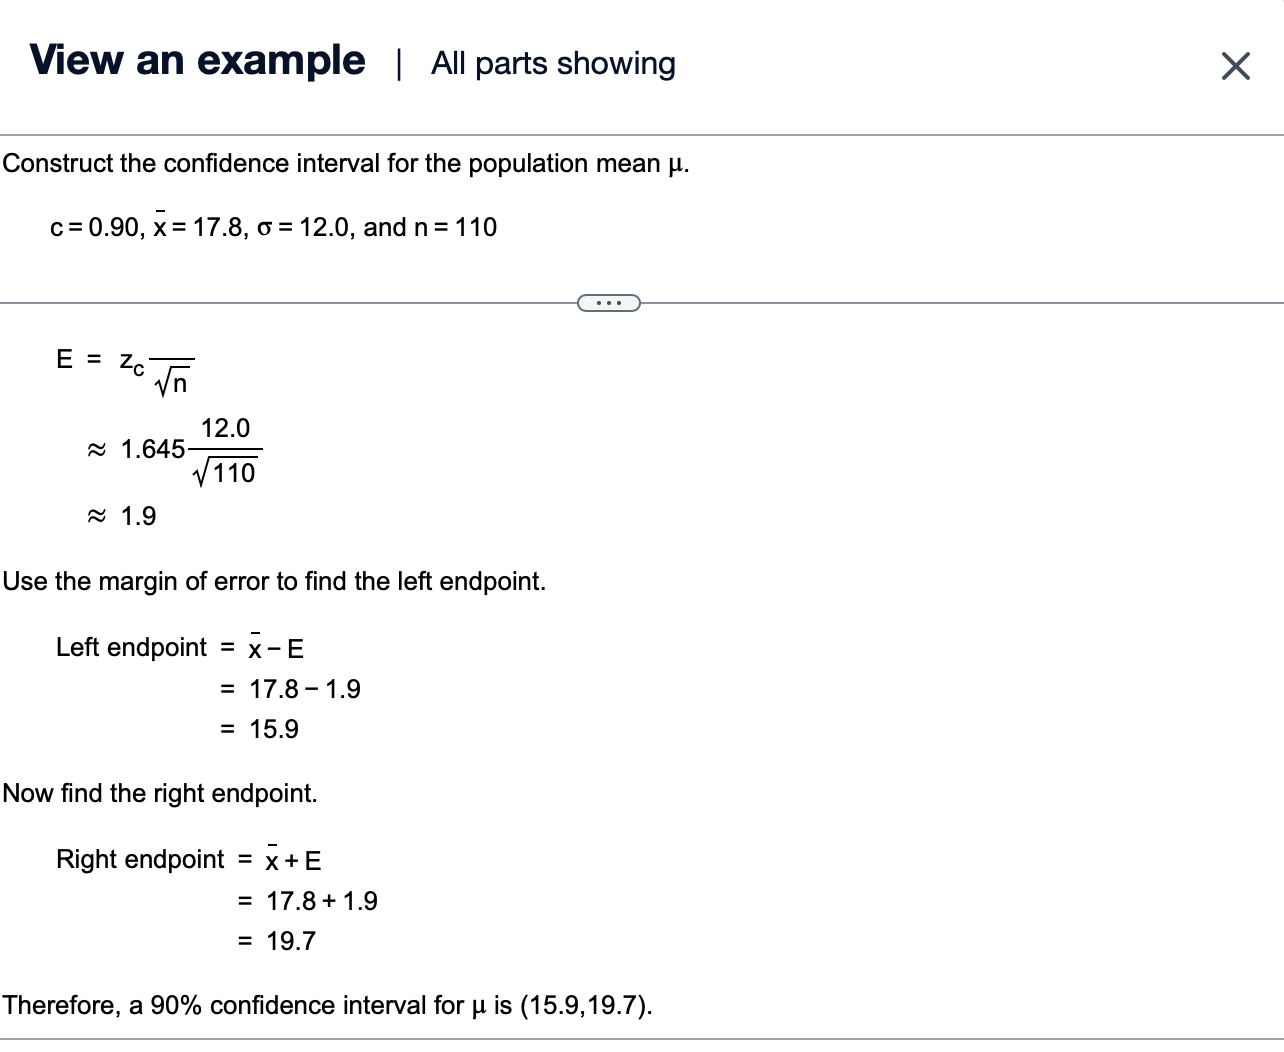
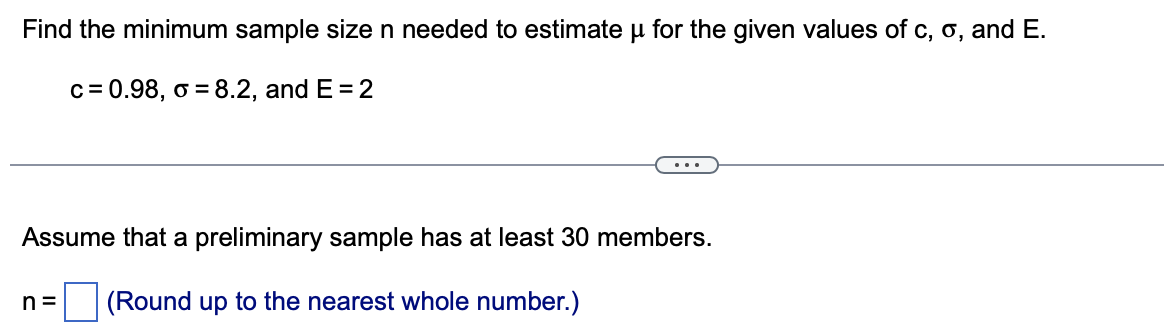
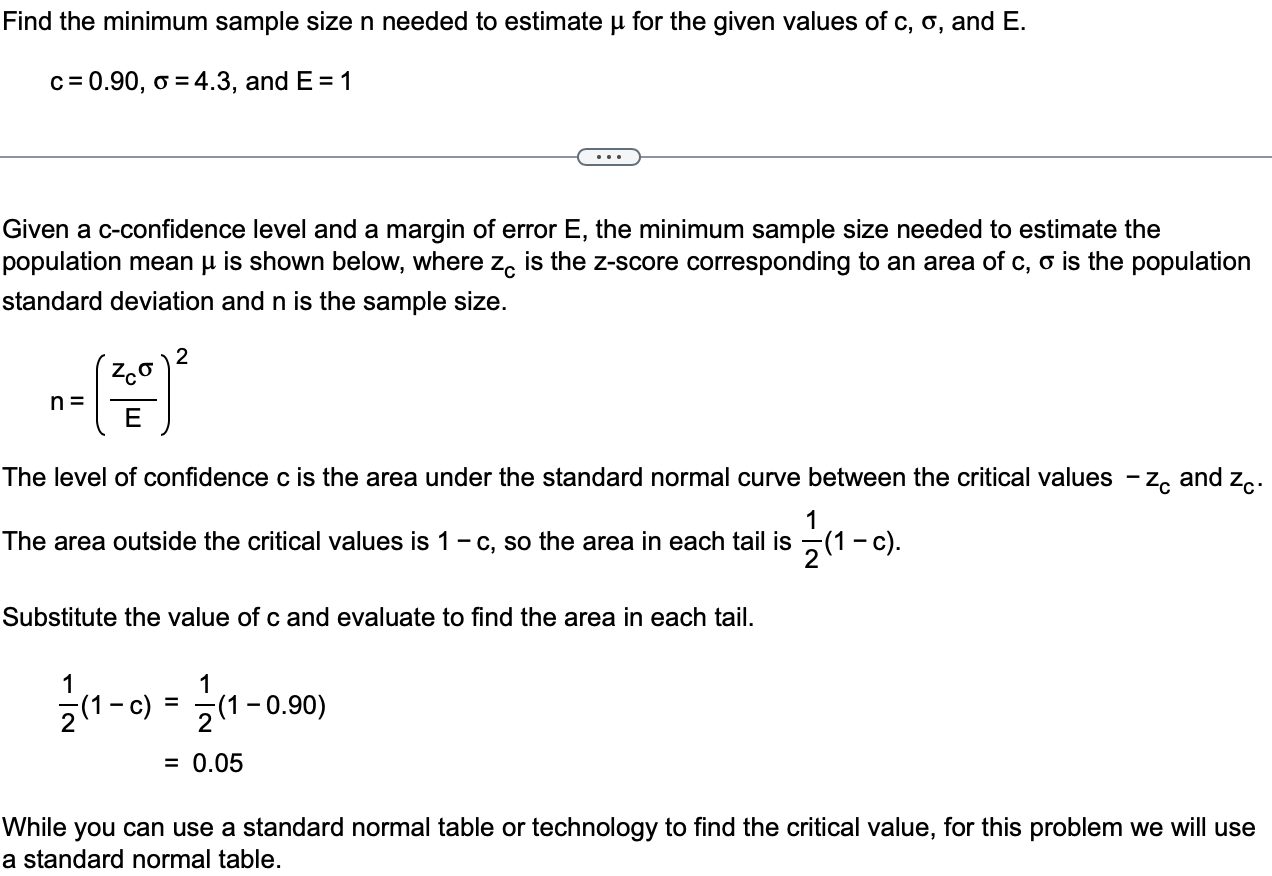
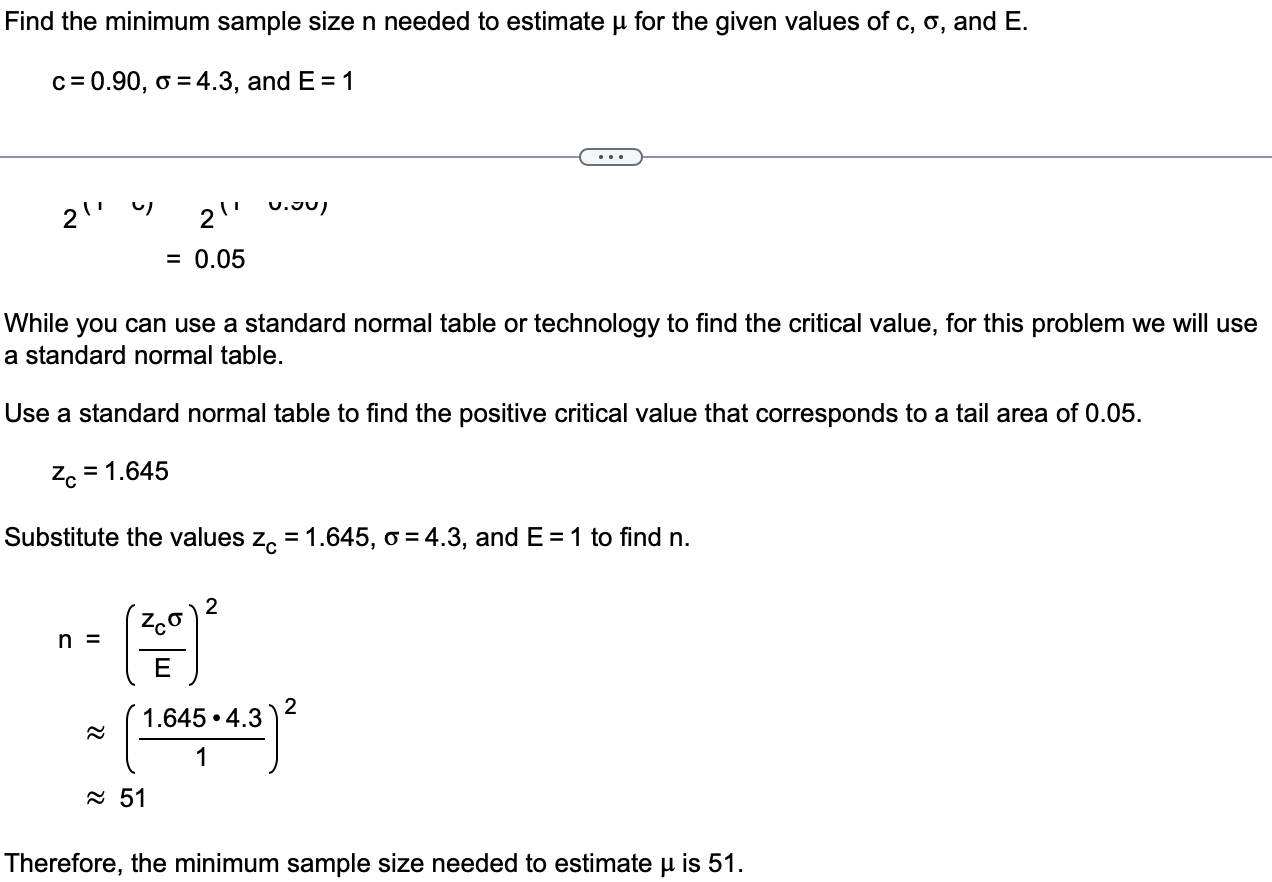
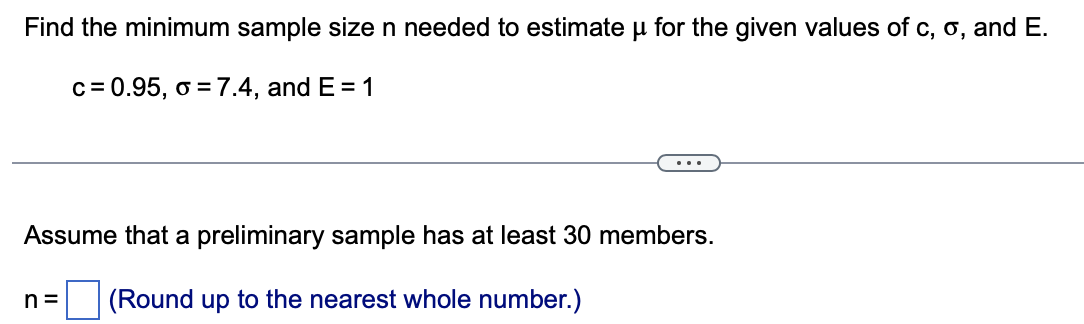
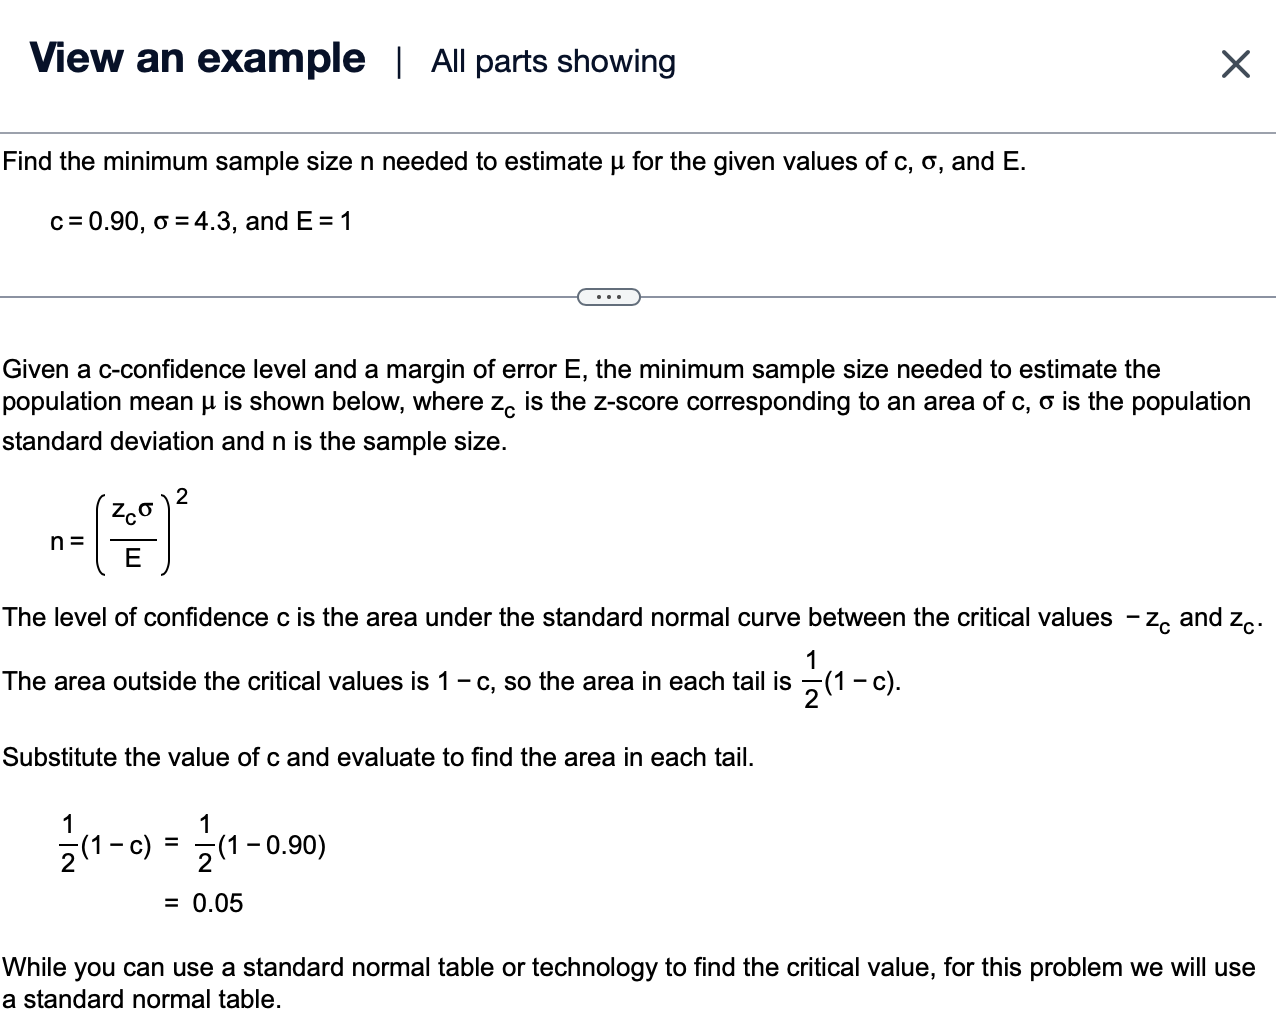

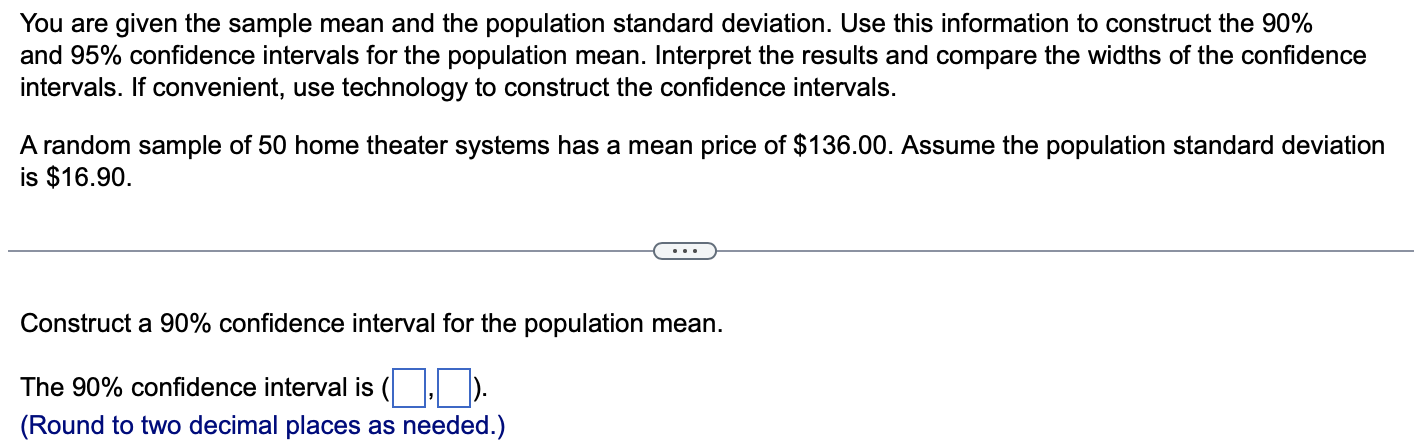
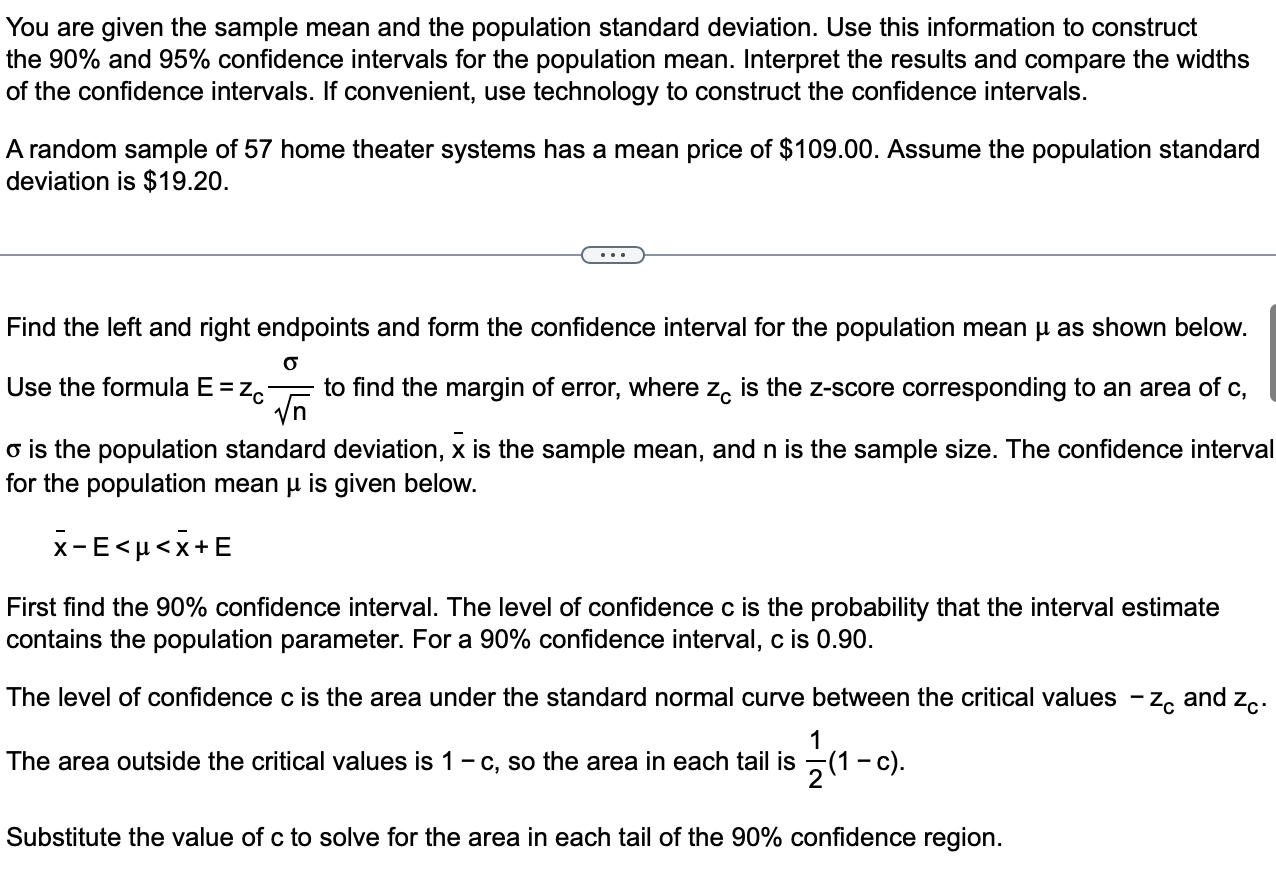
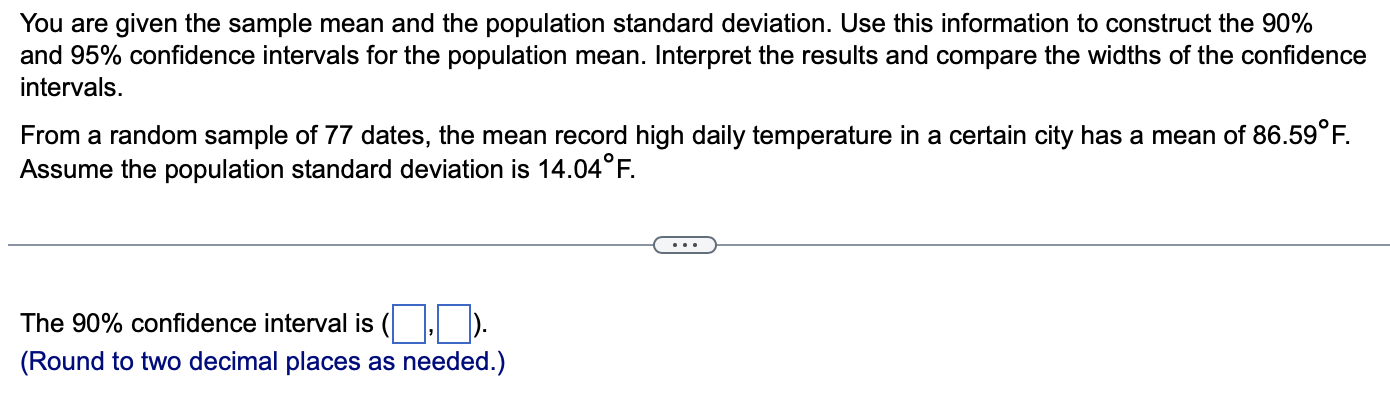
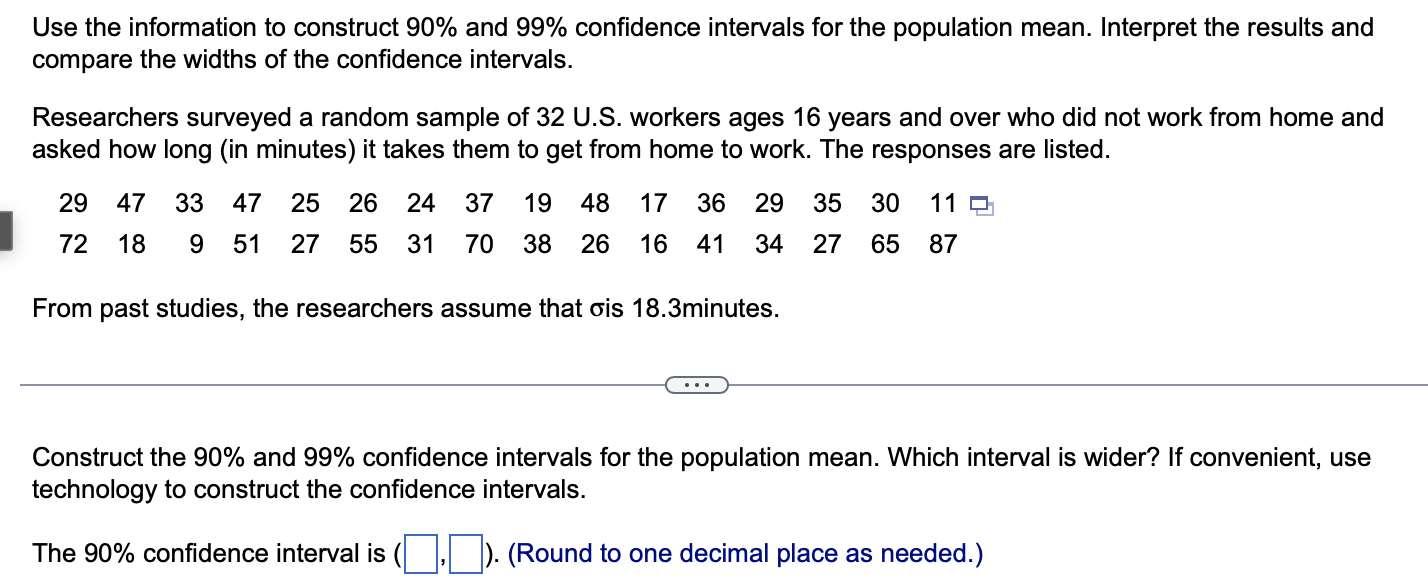
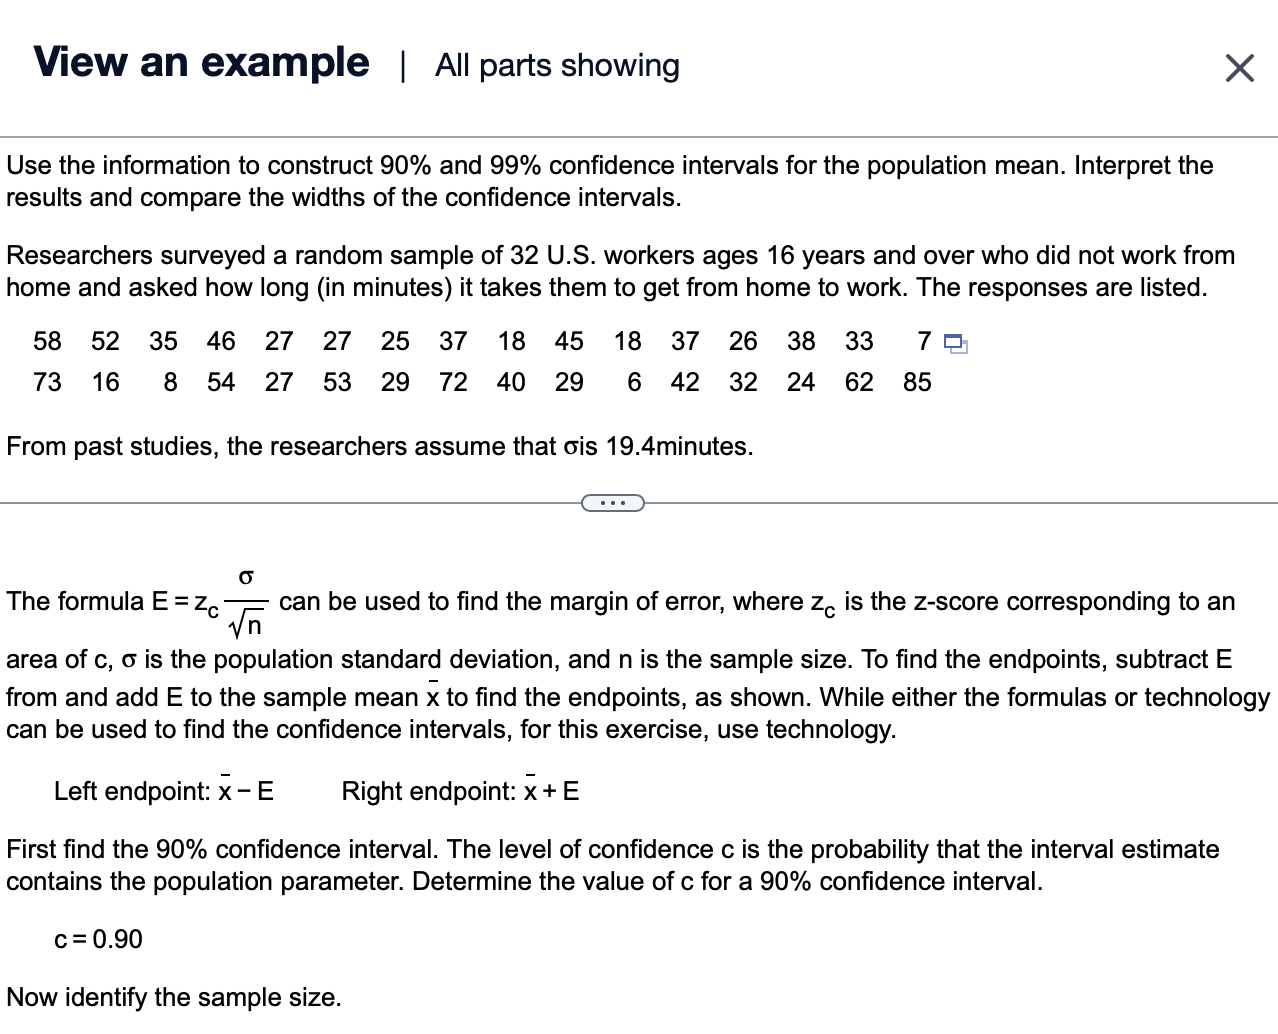
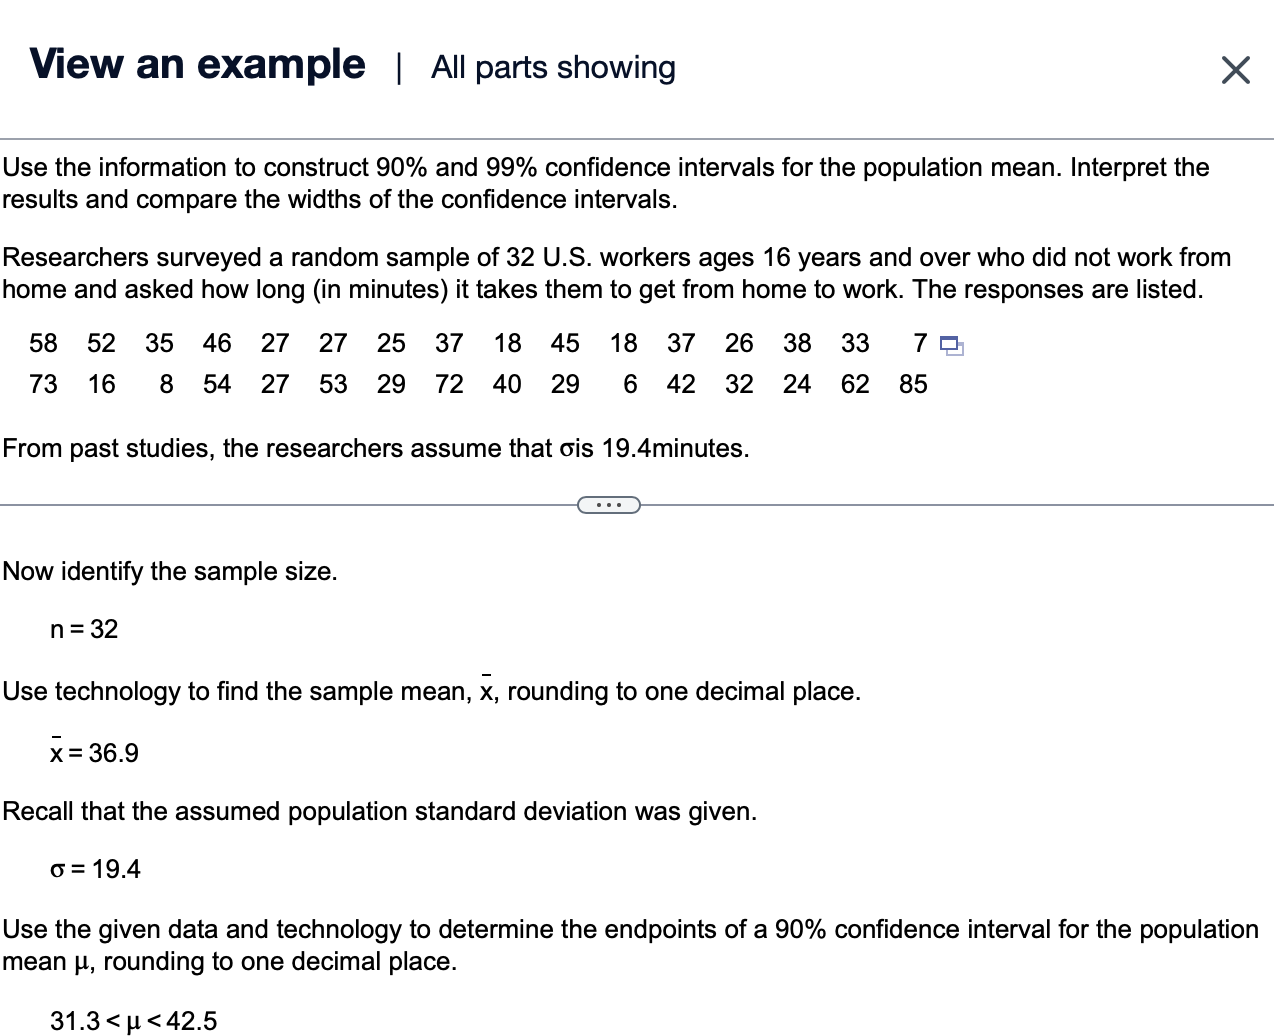
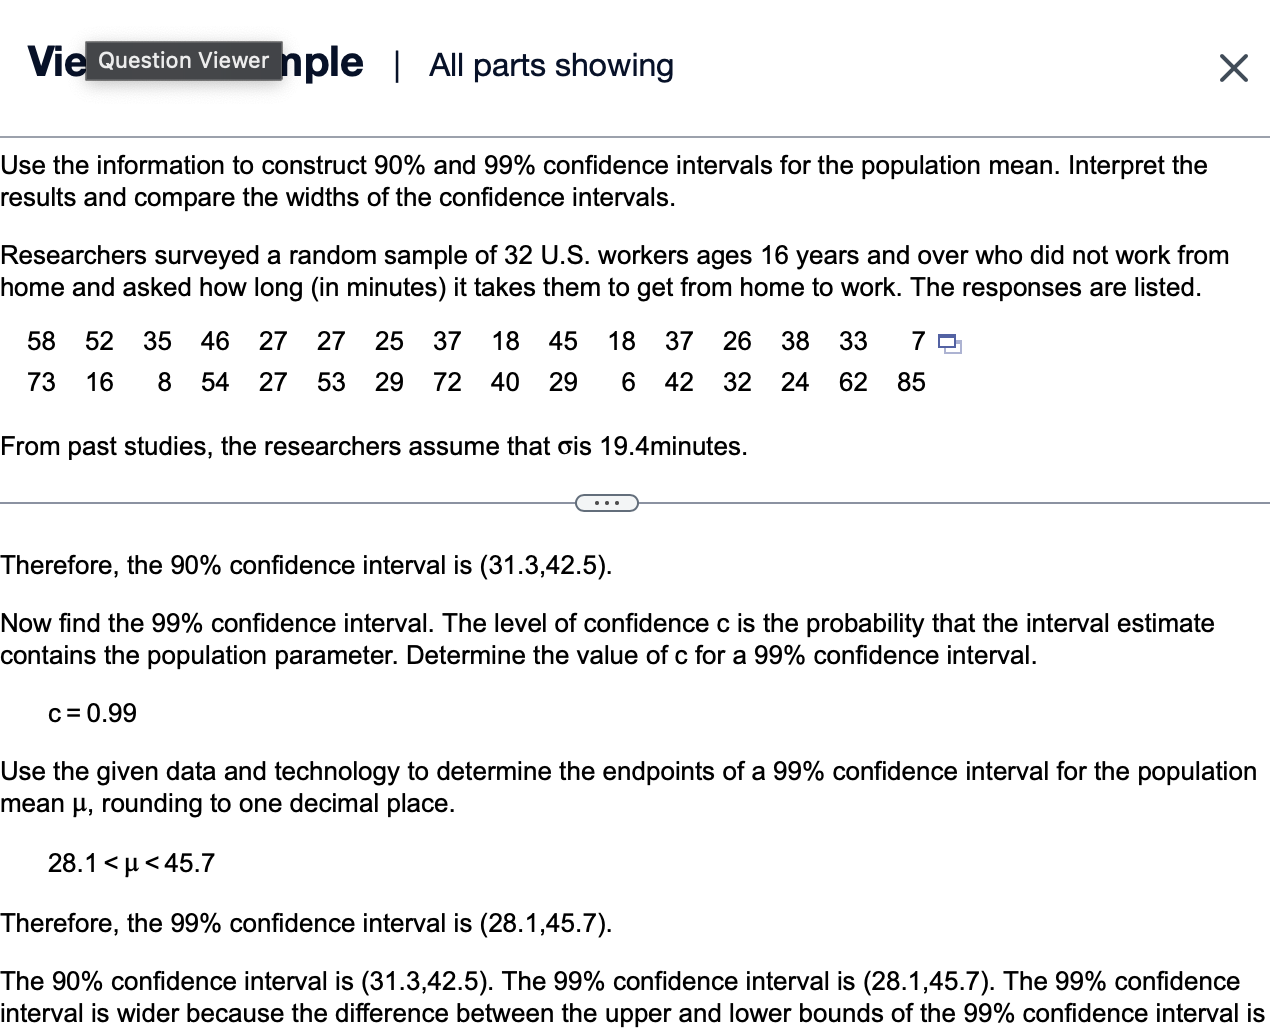

Construct the confidence interval for the population mean u. c = 0.98, x = 15.1, 6=9.0, and n = 90 . . . A 98% confidence interval for u is (Round to one decimal place as needed.)View an example | All parts showing X Construct the confidence interval for the population mean p. c=0.90, x=17.8,6=12.0, and n=110 e Find the left and right endpoints and form the confidence interval for the population mean p as shown below. Use the formula E = zc% to find the margin of error, where z, is the z-score corresponding to an area of c, o is the population standard deviation and n is the sample size. Left endpoint: x-E Right endpoint: X+E The level of confidence c is the area under the standard normal curve between the critical values -z, and z... 1 The area outside the critical values is 1 , so the area in each tail is E('I -C). Substitute the value of and evaluate to find the area in each tail. 1 1 S(1-) = 2(1-0.90) 0.05 While you can use a standard normal table or technology to find the critical value, for this problem we will use a standard normal table. View an example | All parts showing Construct the confidence interval for the population mean . c=0.90,x=17.8,6=12.0, and n=110 000 ), Use a standard normal table to find the positive critical value that corresponds to a tail area of 0.05. z,=1.645 Substitute the values z, =1.645, 6=12.0, and n=110 to find E. o = Zc 12.0 ~ 1.645 /110 ~ 19 Use the margin of error to find the left endpoint. x-E 17.8-1.9 15.9 Left endpoint View an example | All parts showing Construct the confidence interval for the population mean p. c=0.90, x=17.8,6=12.0,and n=110 - Zc 12.0 1.645 4/ 110 Q ~ 19 Use the margin of error to find the left endpoint. Left endpoint = x-E =17.8-1.9 = 15.9 Now find the right endpoint. Right endpoint = x +E 17.8+1.9 19.7 Therefore, a 90% confidence interval for p is (15.9,19.7). Find the minimum sample size n needed to estimate p for the given values of , 6, and E. c=0.98,0=8.2,and E=2 - Assume that a preliminary sample has at least 30 members. n= |:| (Round up to the nearest whole number.) Find the minimum sample size n needed to estimate p for the given values of , , and E. c=0.90,06=4.3,andE=1 T Given a c-confidence level and a margin of error E, the minimum sample size needed to estimate the population mean p is shown below, where z_., is the z-score corresponding to an area of c, is the population standard deviation and n is the sample size. Z.0 2 n=|g" The level of confidence c is the area under the standard normal curve between the critical values -z, and z.. .1 The area outside the critical values is 1 , so the area in each tail is 3(1 -C). Substitute the value of and evaluate to find the area in each tail. 11 11090 5( c) 5( .90) 0.05 While you can use a standard normal table or technology to find the critical value, for this problem we will use a standard normal table. Find the minimum sample size n needed to estimate p for the given values of , 6, and E. c=090,0=4.3,and E=1 v) 2\\I 2\\I U.\\'JU} = 0.05 While you can use a standard normal table or technology to find the critical value, for this problem we will use a standard normal table. Use a standard normal table to find the positive critical value that corresponds to a tail area of 0.05. z,=1.645 Substitute the values z, = 1.645, 6=4.3, and E=1 to find n. 2 Z.C n= [ E ~ [1645:4.3)7 1 ~ 51 Therefore, the minimum sample size needed to estimate p is 51. Find the minimum sample size n needed to estimate u for the given values of c, o, and E. c = 0.95, o =7.4, and E = 1 Assume that a preliminary sample has at least 30 members. n= (Round up to the nearest whole number.)View an example | All parts showing X Find the minimum sample size n needed to estimate p for the given values of , 6, and E. c=0.90,0=43,andE=1 > Given a c-confidence level and a margin of error E, the minimum sample size needed to estimate the population mean p is shown below, where z. is the z-score corresponding to an area of , is the population standard deviation and n is the sample size. zZ.0 2 n=|g The level of confidence c is the area under the standard normal curve between the critical values -z and z.. 1 The area outside the critical values is 1 - c, so the area in each tail is E('I -C). Substitute the value of and evaluate to find the area in each tail. 11_ 5( c) 1 =(1-0.90 5(1-0.90) 0.05 While you can use a standard normal table or technology to find the critical value, for this problem we will use a standard normal table. View an example | All parts showing Find the minimum sample size n needed to estimate p for the given values of , , and E. c=0.90,0=4.3,and E=1 2\\I b} 2\\I U.\\'IU} = 0.05 While you can use a standard normal table or technology to find the critical value, for this problem we will use a standard normal table. Use a standard normal table to find the positive critical value that corresponds to a tail area of 0.05. z,=1.645 Substitute the values z; =1.645, 6 =4.3, and E=1 to find n. 2 rA n= | _ E _ (1.645+4.3)2 1 ~ 51 Therefore, the minimum sample size needed to estimate p is 51. You are given the sample mean and the population standard deviation. Use this information to construct the 90% and 95% confidence intervals for the population mean. Interpret the results and compare the widths of the confidence intervals. If convenient, use technology to construct the confidence intervals. A random sample of 50 home theater systems has a mean price of $136.00. Assume the population standard deviation is $16.90. (TS Construct a 90% confidence interval for the population mean. The 90% confidence interval is (D,D). (Round to two decimal places as needed.) You are given the sample mean and the population standard deviation. Use this information to construct the 90% and 95% confidence intervals for the population mean. Interpret the results and compare the widths of the confidence intervals. If convenient, use technology to construct the confidence intervals. A random sample of 57 home theater systems has a mean price of $109.00. Assume the population standard deviation is $19.20. ) Find the left and right endpoints and form the confidence interval for the population mean p as shown below. c Use the formula E = ZCT to find the margin of error, where z, is the z-score corresponding to an area of c, n is the population standard deviation, X is the sample mean, and n is the sample size. The confidence interval for the population mean p is given below. x-E
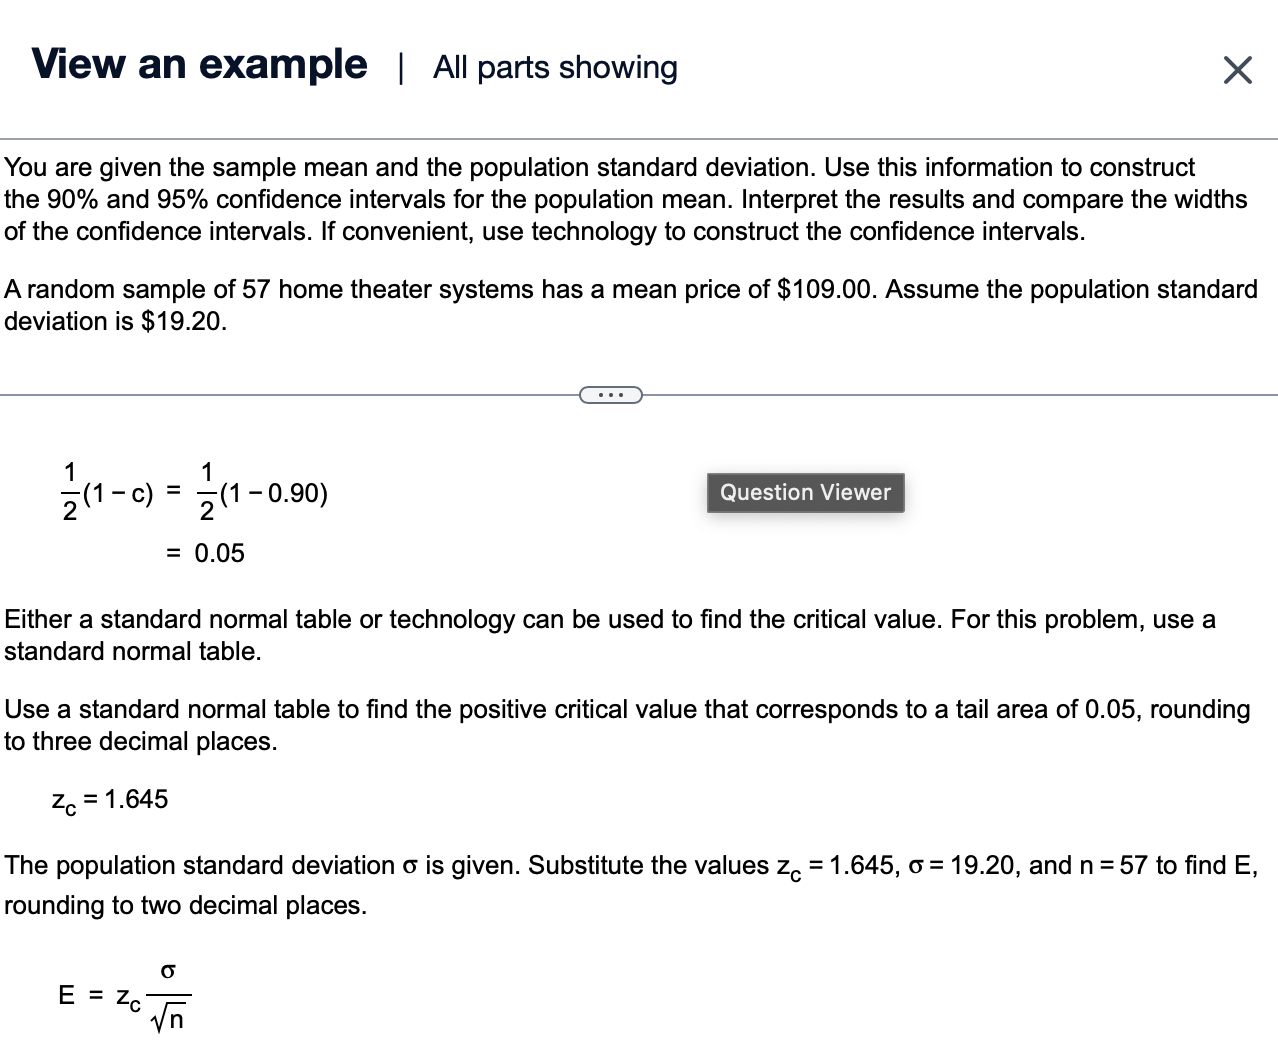
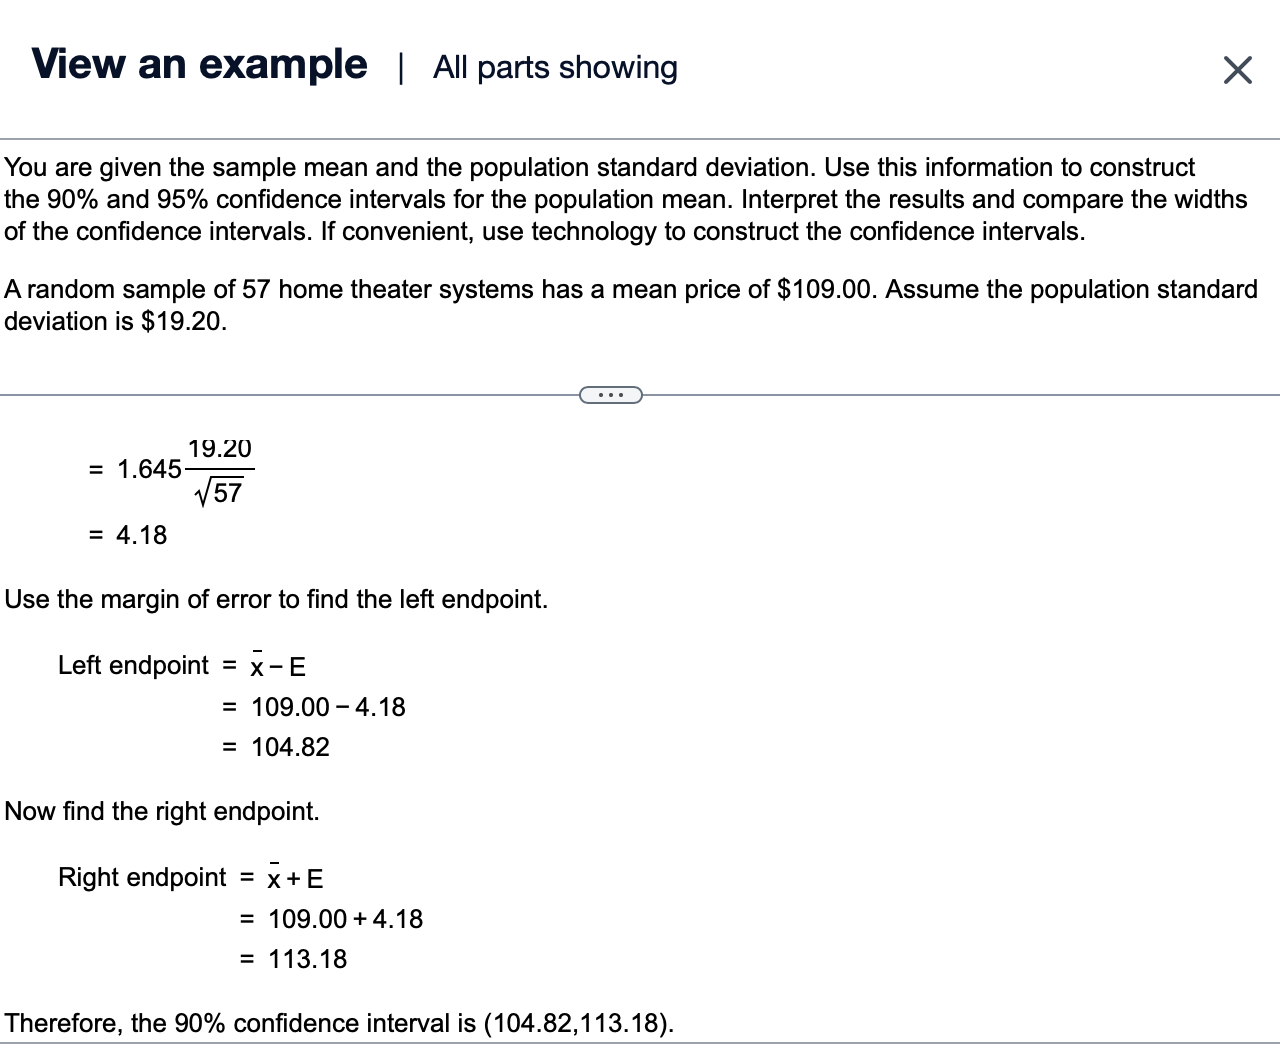
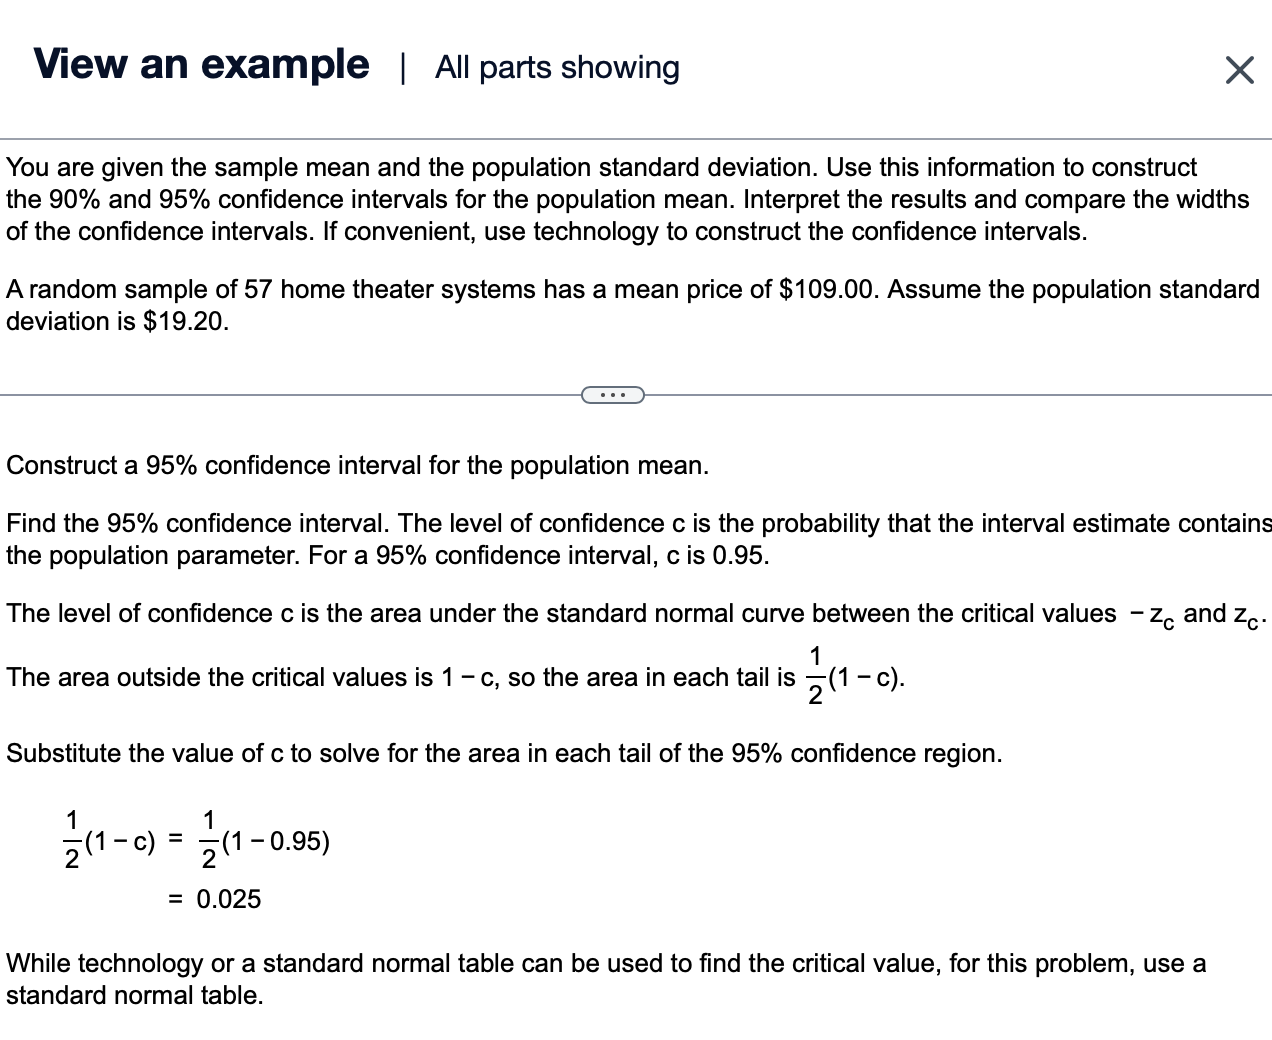
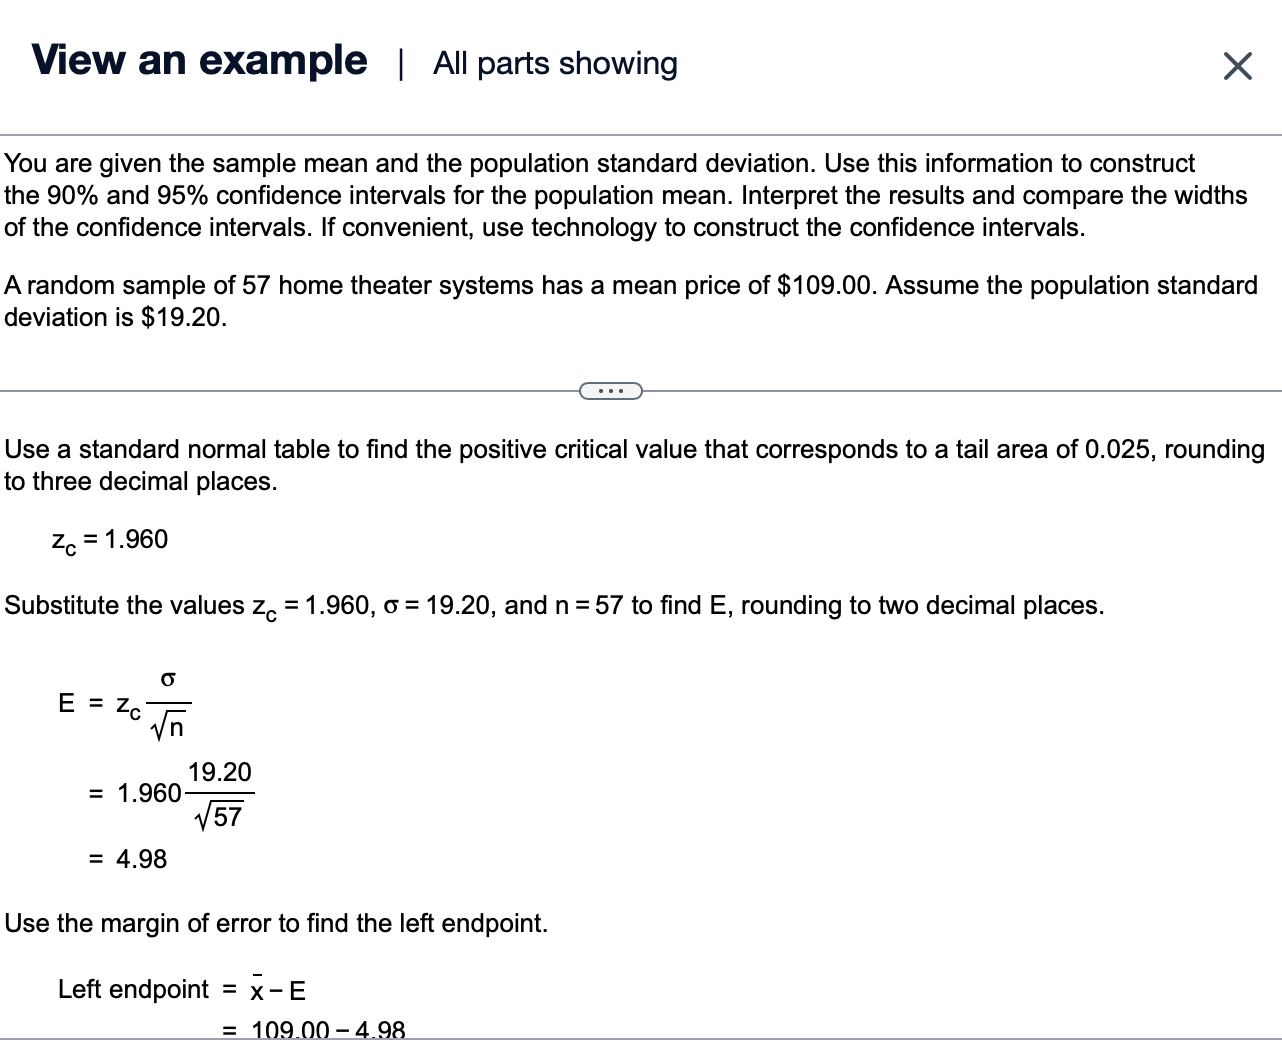
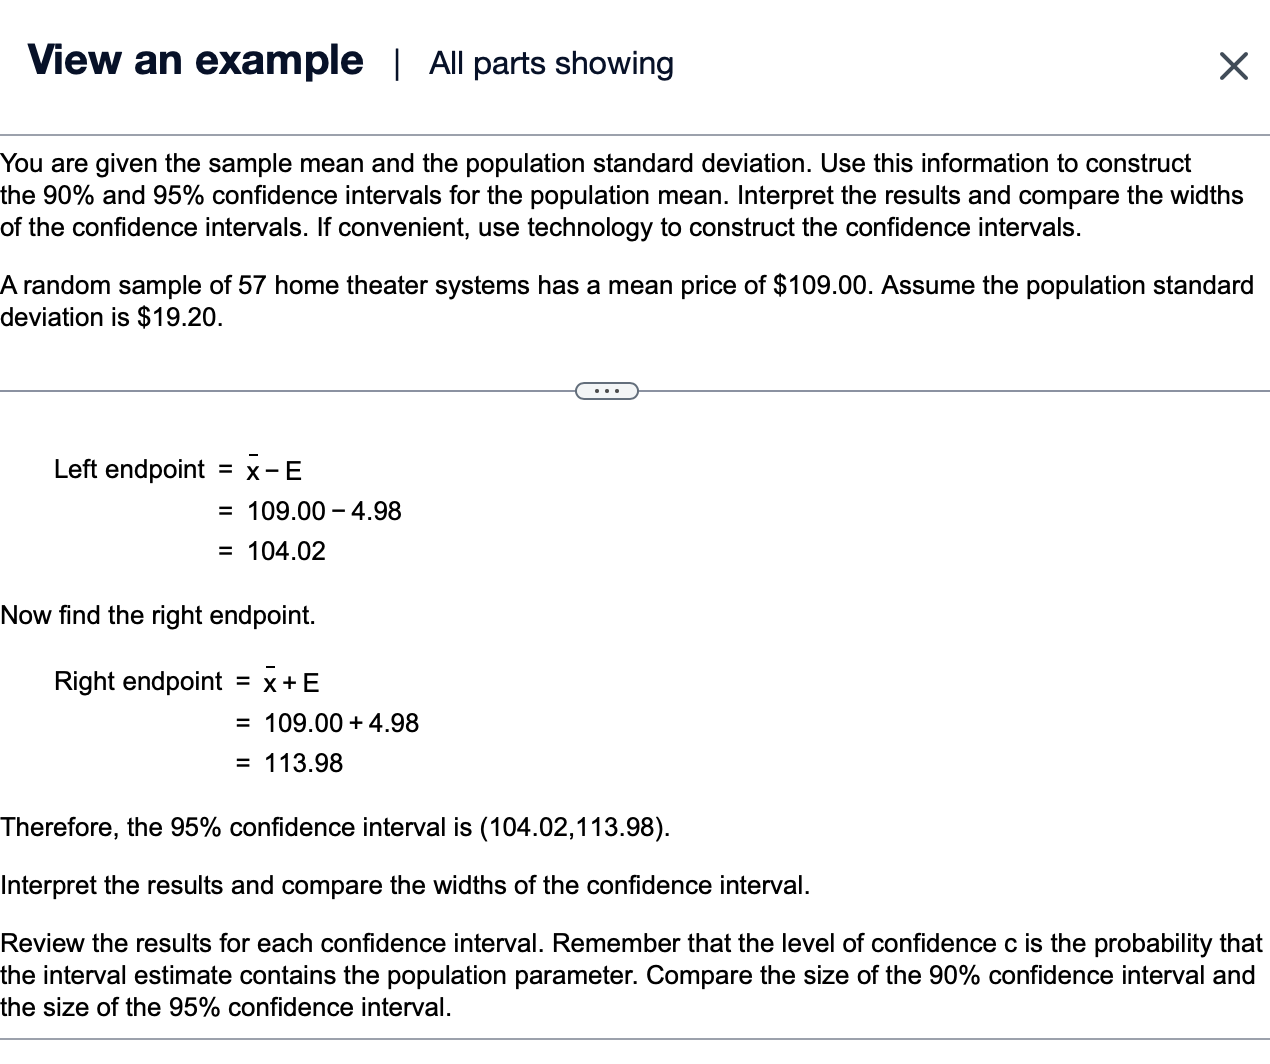
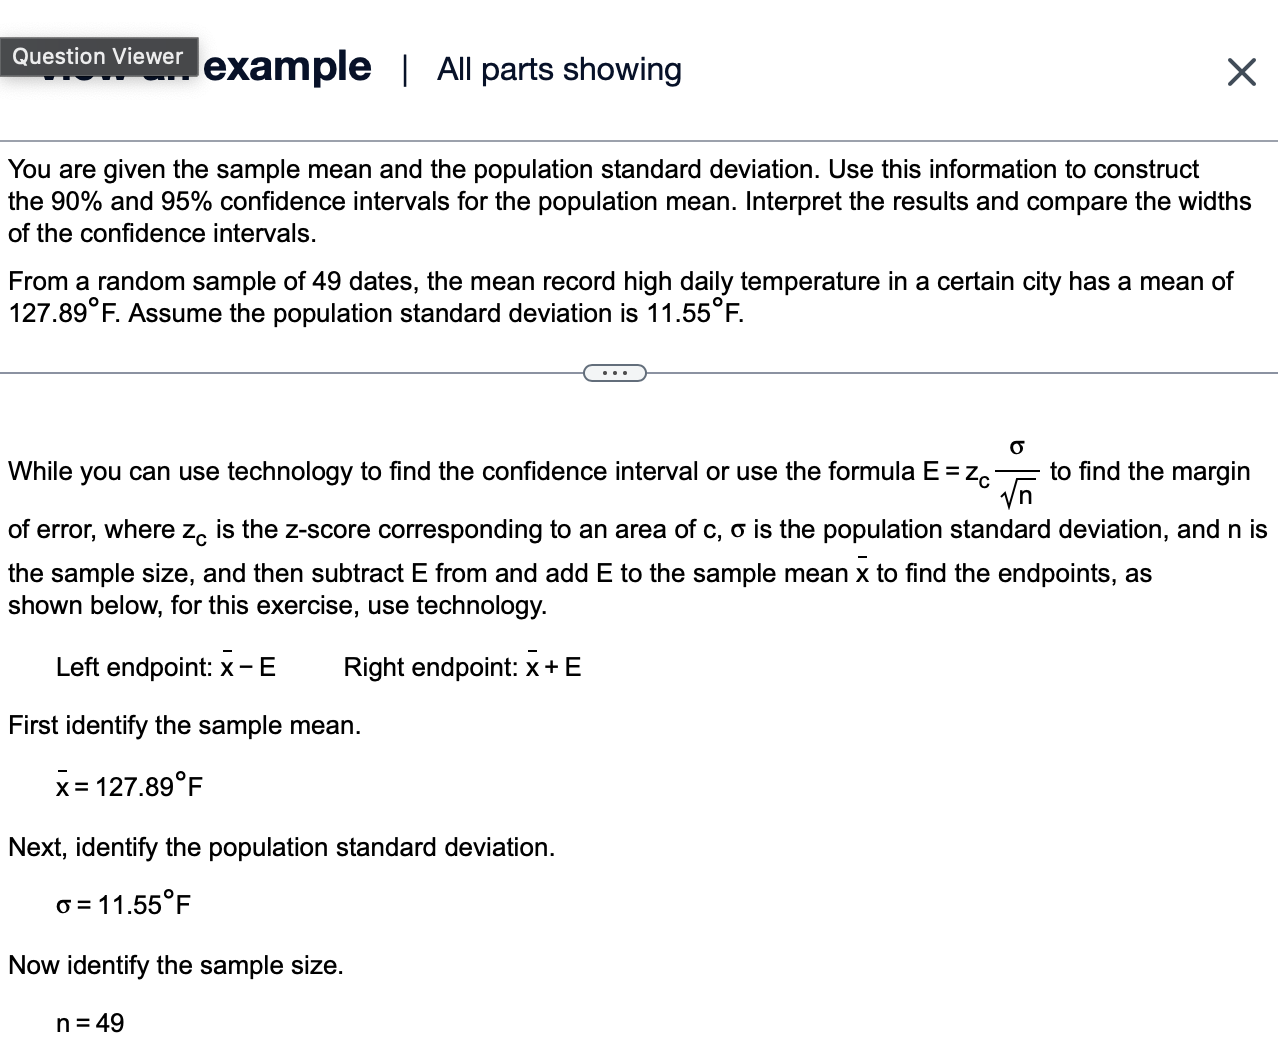
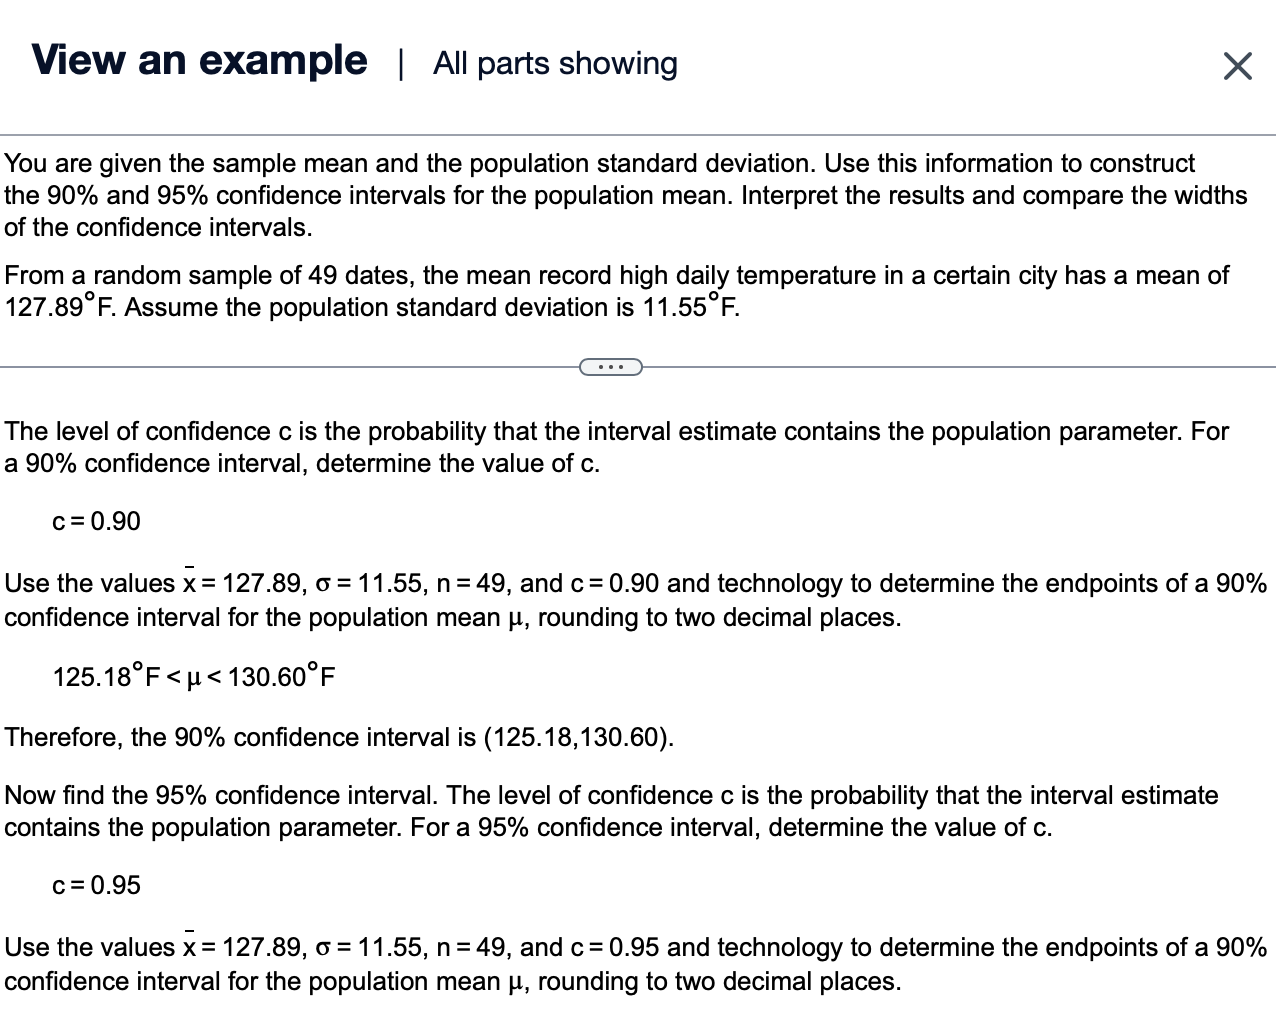
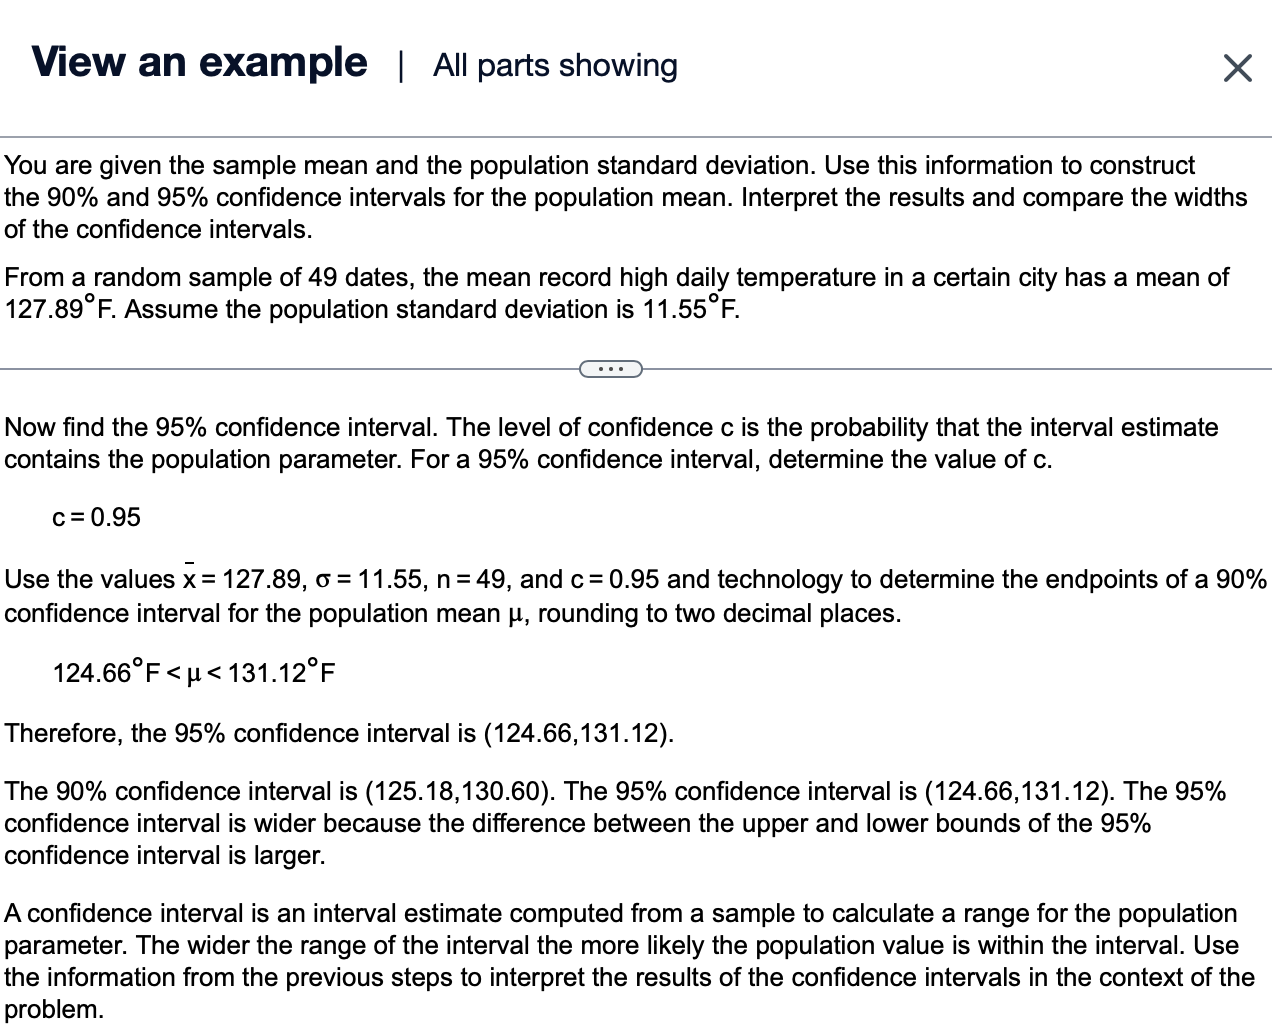
(1-0) = 5(1-0.90) 0.05 Either a standard normal table or technology can be used to find the critical value. For this problem, use a standard normal table. Use a standard normal table to find the positive critical value that corresponds to a tail area of 0.05, rounding to three decimal places. z,=1.645 The population standard deviation is given. Substitute the values z, = 1.645, 0= 19.20, and n =57 to find E, rounding to two decimal places. View an example | All parts showing X You are given the sample mean and the population standard deviation. Use this information to construct the 90% and 95% confidence intervals for the population mean. Interpret the results and compare the widths of the confidence intervals. If convenient, use technology to construct the confidence intervals. A random sample of 57 home theater systems has a mean price of $109.00. Assume the population standard deviation is $19.20. I - D B T 4.18 Use the margin of error to find the left endpoint. x-E 109.00-4.18 104.82 Left endpoint Now find the right endpoint. Right endpoint = x+E 109.00+4.18 113.18 Therefore, the 90% confidence interval is (104.82,113.18). View an example | All parts showing X You are given the sample mean and the population standard deviation. Use this information to construct the 90% and 95% confidence intervals for the population mean. Interpret the results and compare the widths of the confidence intervals. If convenient, use technology to construct the confidence intervals. A random sample of 57 home theater systems has a mean price of $109.00. Assume the population standard deviation is $19.20. =D Construct a 95% confidence interval for the population mean. Find the 95% confidence interval. The level of confidence c is the probability that the interval estimate contains the population parameter. For a 95% confidence interval, c is 0.95. The level of confidence c is the area under the standard normal curve between the critical values -z and z... 1 The area outside the critical values is 1 - , so the area in each tail is 5(1 -C). Substitute the value of to solve for the area in each tail of the 95% confidence region. 11 11095 5( c) 5( .95) 0.025 While technology or a standard normal table can be used to find the critical value, for this problem, use a standard normal table. View an example | All parts showing % You are given the sample mean and the population standard deviation. Use this information to construct the 90% and 95% confidence intervals for the population mean. Interpret the results and compare the widths of the confidence intervals. If convenient, use technology to construct the confidence intervals. A random sample of 57 home theater systems has a mean price of $109.00. Assume the population standard deviation is $19.20. ({ETTw) Use a standard normal table to find the positive critical value that corresponds to a tail area of 0.025, rounding to three decimal places. z,=1.960 Substitute the values z, =1.960, 6 = 19.20, and n =57 to find E, rounding to two decimal places. I - R T 4.98 Use the margin of error to find the left endpoint. x-E 109.00-4 98 Left endpoint View an example | All parts showing X You are given the sample mean and the population standard deviation. Use this information to construct the 90% and 95% confidence intervals for the population mean. Interpret the results and compare the widths of the confidence intervals. If convenient, use technology to construct the confidence intervals. A random sample of 57 home theater systems has a mean price of $109.00. Assume the population standard deviation is $19.20. Left endpoint = x-E 109.00-4.98 104.02 Now find the right endpoint. Right endpoint = x+E 109.00 +4.98 113.98 Therefore, the 95% confidence interval is (104.02,113.98). Interpret the results and compare the widths of the confidence interval. Review the results for each confidence interval. Remember that the level of confidence c is the probability that the interval estimate contains the population parameter. Compare the size of the 90% confidence interval and the size of the 95% confidence interval. You are given the sample mean and the population standard deviation. Use this information to construct the 90% and 95% confidence intervals for the population mean. Interpret the results and compare the widths of the confidence intervals. From a random sample of 77 dates, the mean record high daily temperature in a certain city has a mean of 86.59F. Assume the population standard deviation is 14.04F. The 90% confidence interval is (I:I,I:I). (Round to two decimal places as needed.) example | All parts showing X You are given the sample mean and the population standard deviation. Use this information to construct the 90% and 95% confidence intervals for the population mean. Interpret the results and compare the widths of the confidence intervals. From a random sample of 49 dates, the mean record high daily temperature in a certain city has a mean of 127.89F. Assume the population standard deviation is 11.55F. > While you can use technology to find the confidence interval or use the formulaE=z to find the margin c C of error, where z_, is the z-score corresponding to an area of , is the population standard deviation, and n is the sample size, and then subtract E from and add E to the sample mean x to find the endpoints, as shown below, for this exercise, use technology. Left endpoint: x-E Right endpoint: x+E First identify the sample mean. x=127.89F Next, identify the population standard deviation. c=1155F Now identify the sample size. n=49 View an example | All parts showing X You are given the sample mean and the population standard deviation. Use this information to construct the 90% and 95% confidence intervals for the population mean. Interpret the results and compare the widths of the confidence intervals. From a random sample of 49 dates, the mean record high daily temperature in a certain city has a mean of 127.89F. Assume the population standard deviation is 11.55F. 000 ) The level of confidence c is the probability that the interval estimate contains the population parameter. For a 90% confidence interval, determine the value of c. c=0.90 Use the values x = 127.89, 6 = 11.55, n =49, and = 0.90 and technology to determine the endpoints of a 90% confidence interval for the population mean p, rounding to two decimal places. 125.18F Now find the 95% confidence interval. The level of confidence c is the probability that the interval estimate contains the population parameter. For a 95% confidence interval, determine the value of c. c=0.95 Use the values x = 127.89, 6 = 11.55, n=49, and c=0.95 and technology to determine the endpoints of a 90% confidence interval for the population mean p, rounding to two decimal places. 124.66F
Step by Step Solution
There are 3 Steps involved in it

Get step-by-step solutions from verified subject matter experts