

Question: #5 control chart. Use the following data to create a c chart. If the customer wants a process capability of 1 , will this line
#5 
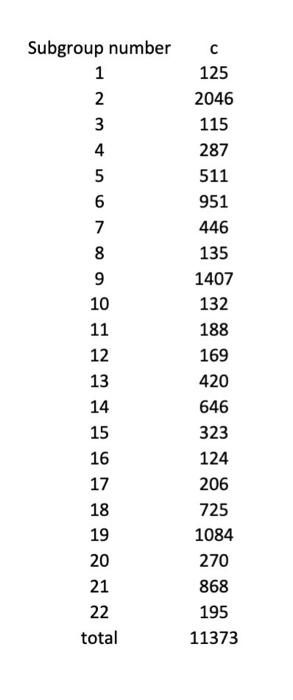
control chart. Use the following data to create a c chart. If the customer wants a process capability of 1 , will this line be able to meet that requirement? Q5. The company reviewing its safety program has decided to track the expenses associated with medical treatments related to accidents in the workplace. Each of the following values represents an individual case (n = 1). Create the control limits and centerline for this chart. Graph and interpret this chart. What will be the average cost of future medical claims? The highest expected costs? Subgroupnumber12345678910111213141516171819202122totalc12520461152875119514461351407132188169420646323124206725108427086819511373
Step by Step Solution
There are 3 Steps involved in it
1 Expert Approved Answer
Step: 1 Unlock

Question Has Been Solved by an Expert!
Get step-by-step solutions from verified subject matter experts
Step: 2 Unlock
Step: 3 Unlock