

Question: Create a control chart for the following data on the average product weight (Sample size = 5). Create a control chart for the following data
 Create a control chart for the following data on the average product weight (Sample size = 5).
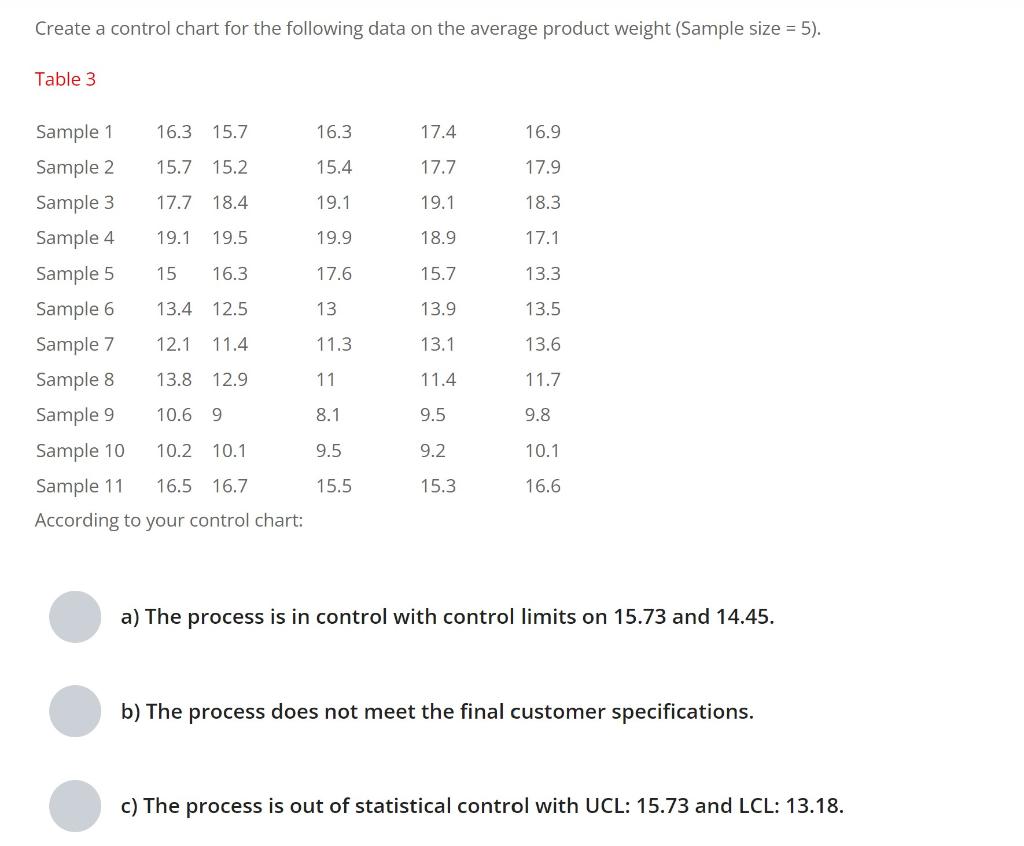
Create a control chart for the following data on the average product weight (Sample size = 5). Table 3 According to your control chart: a) The process is in control with control limits on 15.73 and 14.45 . b) The process does not meet the final customer specifications. c) The process is out of statistical control with UCL: 15.73 and LCL: 13.18
Step by Step Solution
There are 3 Steps involved in it
1 Expert Approved Answer
Step: 1 Unlock

Question Has Been Solved by an Expert!
Get step-by-step solutions from verified subject matter experts
Step: 2 Unlock
Step: 3 Unlock