

Question: 5. Develop a multiple-regression model for auto sales as a function of population and household income from the following data for 10 metropolitan areas: Auto
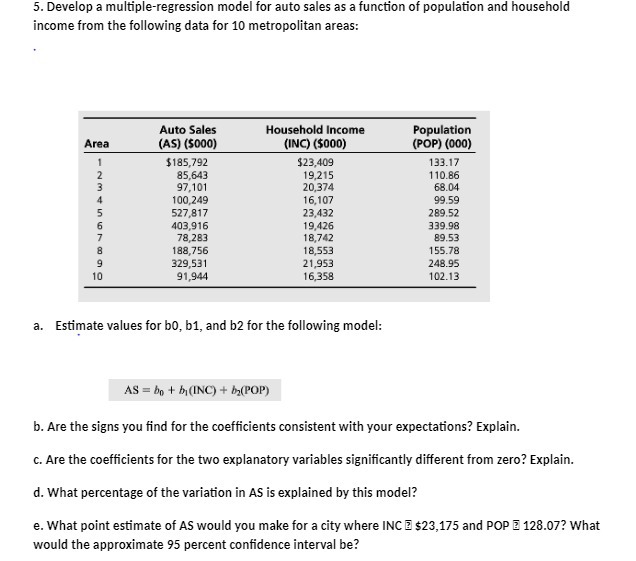
5. Develop a multiple-regression model for auto sales as a function of population and household income from the following data for 10 metropolitan areas: Auto Sales Household Income Population Area (AS) (5000) (INC) ($000) (POP) (000) $185,792 $23,409 133.17 85.643 19.215 110.86 97,101 20.374 68.04 100,249 16,107 99.59 527,817 23,432 289.52 403,916 19,426 78,283 339.98 18,742 89.53 188,756 18,553 155.78 329,531 21,953 248.95 91,944 16,358 102.13 a. Estimate values for b0, b1, and b2 for the following model: AS = bo + b(INC) + b(POP) b. Are the signs you find for the coefficients consistent with your expectations? Explain. c. Are the coefficients for the two explanatory variables significantly different from zero? Explain. d. What percentage of the variation in AS is explained by this model? e. What point estimate of AS would you make for a city where INC B $23,175 and POP _ 128.07? What would the approximate 95 percent confidence interval be
Step by Step Solution
There are 3 Steps involved in it

Get step-by-step solutions from verified subject matter experts