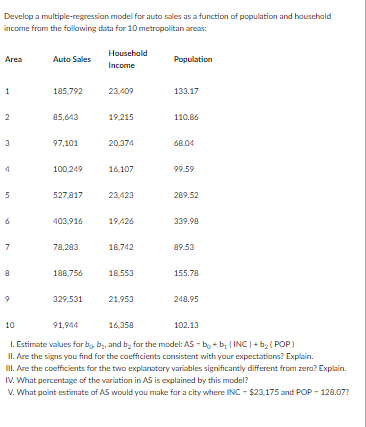
Question: Develop a multiple-regression model for auto sales as a function of population and household income from the following data for 10 metropolitan areas: Area Auto

Develop a multiple-regression model for auto

Develop a multiple-regression model for auto sales as a function of population and household income from the following data for 10 metropolitan areas: Area Auto Sales Household Income Population 1 185,792 23.409 132.17 2 85,643 19.215 110.86 3 97,101 20.374 68.04 4 100249 16, 107 99.59 5 527.817 23.423 289.52 6 403.916 19.426 339.90 7 78,223 18.742 29.53 8 188.756 18.553 155.78 9 329.531 21.953 248.95 10 91,944 16,350 102.13 1. Estimate values for by by, and by for the model: AS - bo+b(INC) + b (POP) II. Are the signs you find for the coefficients consistent with your expectations? Explain. III. Are the coefficients for the two explanatory variables significantly different from zero? Explain. IV. What percentage of the variation in AS is explained by this model? V. What point estimate of AS would you make for a city where INC - $23,175 and POP - 120.07

Step by Step Solution

There are 3 Steps involved in it

1 Expert Approved Answer
Step: 1 Unlock blur-text-image
Question Has Been Solved by an Expert!

Get step-by-step solutions from verified subject matter experts

Step: 2 Unlock
Step: 3 Unlock

Students Have Also Explored These Related General Management Questions!