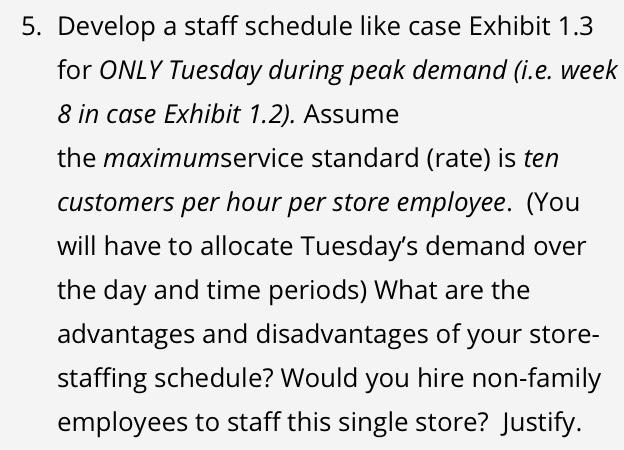
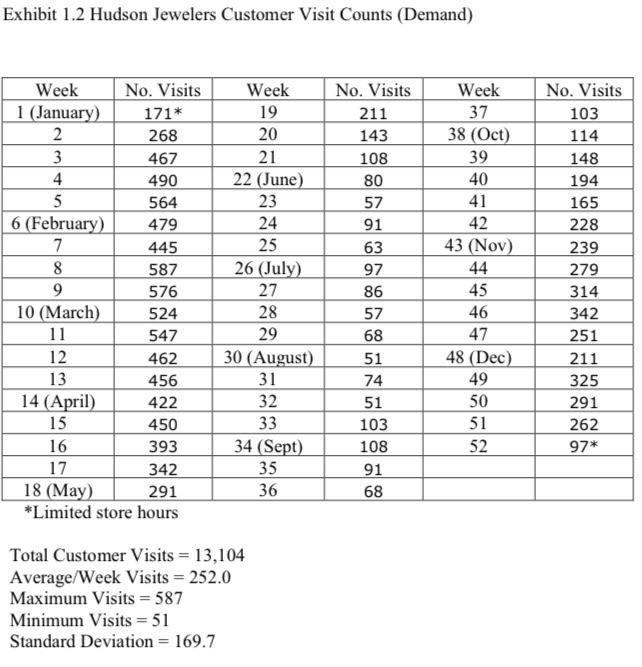
Question: 5. Develop a staff schedule like case Exhibit 1.3 for ONLY Tuesday during peak demand (i.e. week 8 in case Exhibit 1.2). Assume the maximumservice

5. Develop a staff schedule like case Exhibit 1.3
5. Develop a staff schedule like case Exhibit 1.3 for ONLY Tuesday during peak demand (i.e. week 8 in case Exhibit 1.2). Assume the maximumservice standard (rate) is ten customers per hour per store employee. (You will have to allocate Tuesday's demand over the day and time periods) What are the advantages and disadvantages of your store- staffing schedule? Would you hire non-family employees to staff this single store? Justify. Exhibit 1.3 Hudson Jewelers Tuesday Store Staff Schedule+ 300 236 TOENS 1536 2:00 1230 9336 1100 12:00 12:50 10-00130 100 Staffing Start Lunch Lunch) Start Lunch Lunch) Start By Hudson Josine Navy Betty Hudson Thomas Nivey Possible stat Possible staff O 0 301 1 HO 2 18 1 30 1 a 0 0 1 6 2 8 2 6 2 9 2 11 11 6 Current St Minutes Current Staff customer Vis Target Start Short Excess Staffing 3:30 4:00 5:00 3:30 6:00 630 7:00 7:30 8:00 Totals Grand Total End End End B Hudson Jasime Novey Betty Hudson Thomas Novey Possible Staf A Possible stats Start End 20 90 60 GA 2 3 90 3 4 Current Staff Minutes Current Staff Customer Visits Target Start ShortExces 4) 60 2 5 60 2 sho 2 6 60 2 2 700 23 40 1260 41 37 4 +An Excel model of all case exhibits accompanies the case and can be provided by the instructor *Using Equation 7.2 Utilization Demand Rate/Service Rate Number Servers) or assume 100% - 11/[5N] or N - 2.2 employees Exhibit 1.2 Hudson Jewelers Customer Visit Counts (Demand) Week No. Visits 1 (January) 171* 2 268 3 467 4 490 5 564 6 (February) 479 7 445 8 587 9 576 10 (March) 524 11 547 12 462 13 456 14 (April) 422 15 450 16 393 17 342 18 (May) 291 *Limited store hours Week 19 20 21 22 (June) 23 24 25 26 (July) 27 28 29 30 (August) 31 32 33 No. Visits 211 143 108 80 57 91 63 97 86 57 68 51 74 51 103 108 91 Week 37 38 (Oct) 39 40 41 42 43 (Nov) 44 45 46 47 48 (Dec) 49 50 51 52 No. Visits 103 114 148 194 165 228 239 279 314 342 251 211 325 291 262 97* 34 (Sept) 35 36 68 Total Customer Visits - 13,104 Average/Week Visits - 252.0 Maximum Visits - 587 Minimum Visits - 51 Standard Deviation - 169.7 Exhibit 1.3 Hudson Jewelers Tuesday Store Staff Schedule+ Staffing 9:00 9:30 10:00 10:30 11:00 11:30 12:00 12:30 1:00 1:30 2:00 2:30 3:00 Totais Start (Lunch Lunch) Start (Lunch Lunch) Start Bill Hudson Jasime Navey Betty Hudson Thomas Navey Possible Staff A Possible Staff B Current Staff Minutes Current # Staff Customer Visits Target # Staff Short/Excess (+/+) 0 0 0 ololo 30 1 2 30 1 4 30 1 6 30 1 8 60 2 8 60 2 6 60 2 7 OMBI 60 2 11 60 2 6 540 18 78 2 11 2.2 -0.2 Staffing 3:30 4:00 4:30 5:00 5:30 6:00 6:30 7:00 7:30 8:00 Totals Grand Total End End End Bill Hudson Jasime Navey Betty Hudson Thomas Navey Possible Staff A Possible Staff B Start End Current Staff Minutes Current # Staff Customer Visits Target # Staff Short/Excess (-+) 90 2 3 90 3 3 90 3 4 90 3 4 60 2 5 60 2 6 60 2 7 60 2 6 60 2 4 60 2 2 720 23 44 1260 41 122 +An Excel model of all case exhibits accompanies the case and can be provided by the instructor. *Using Equation 7.2 Utilization = Demand Rate/[Service Rate*Number Servers) or assume 100% = 11/[5*N) or N = 2.2 employees Exhibit 1.2 Hudson Jewelers Customer Visit Counts (Demand) Week 19 Week 37 38 (Oct) 20 21 39 22 (June) 40 23 41 42 43 (Nov) 44 Week No. Visits 1 (January) 171* 2 268 3 467 4 490 5 564 6 (February 479 7 445 8 587 9 576 10 (March) 524 11 547 12 462 13 456 14 (April) 422 15 450 16 393 342 18 (May) 291 *Limited store hours No. Visits 211 143 108 80 57 91 63 97 86 57 68 51 74 24 25 26 (July) 27 28 29 30 (August) 31 32 33 34 (Sept) 35 36 45 No. Visits 103 114 148 194 165 228 239 279 314 342 251 211 325 291 262 97* 46 47 48 (Dec) 49 50 51 52 51 17 103 108 91 68 Total Customer Visits = 13,104 Average/Week Visits = 252.0 Maximum Visits = 587 Minimum Visits = 51 Standard Deviation = 169.7

Step by Step Solution

There are 3 Steps involved in it

1 Expert Approved Answer
Step: 1 Unlock blur-text-image
Question Has Been Solved by an Expert!

Get step-by-step solutions from verified subject matter experts

Step: 2 Unlock
Step: 3 Unlock

Students Have Also Explored These Related General Management Questions!