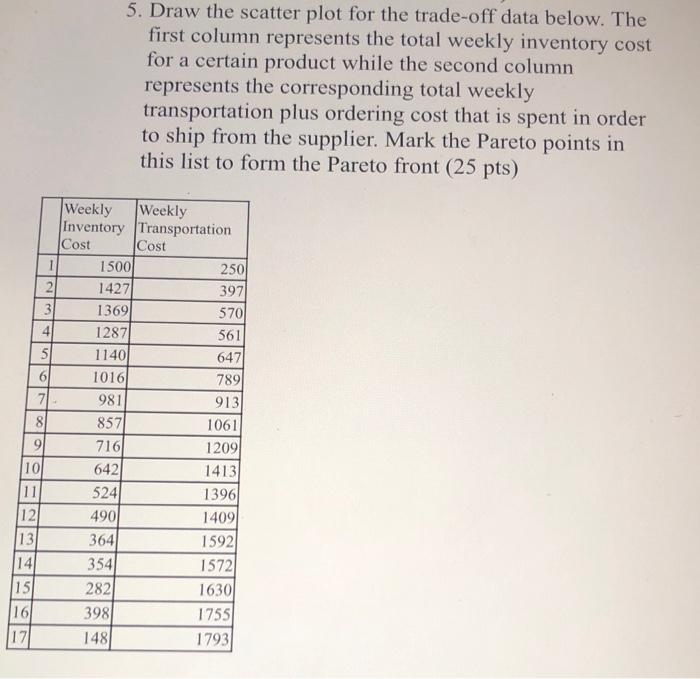
Question: 5. Draw the scatter plot for the trade-off data below. The first column represents the total weekly inventory cost for a certain product while the

5. Draw the scatter plot for the trade-off data
5. Draw the scatter plot for the trade-off data below. The first column represents the total weekly inventory cost for a certain product while the second column represents the corresponding total weekly transportation plus ordering cost that is spent in order to ship from the supplier. Mark the Pareto points in this list to form the Pareto front (25 pts) 397 Weekly Weekly Inventory Transportation Cost Cost 1 15001 2501 2 14271 3 1369 5701 4 1287 561 5 1140 647 6 1016 789 7 981 913 8 857 1061 9 716 1209 10 642 1413 11 524 1396 12 490 14091 13 364 1592 14 354 15721 15 282 16301 16 398 17551 17 148 1793

Step by Step Solution

There are 3 Steps involved in it

1 Expert Approved Answer
Step: 1 Unlock blur-text-image
Question Has Been Solved by an Expert!

Get step-by-step solutions from verified subject matter experts

Step: 2 Unlock
Step: 3 Unlock

Students Have Also Explored These Related General Management Questions!

Q: