

Question: 5) Exhibit A has the information about the change in production volume of sales for a company. This company will pay dividends on earnings of
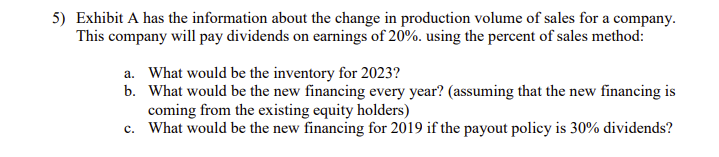
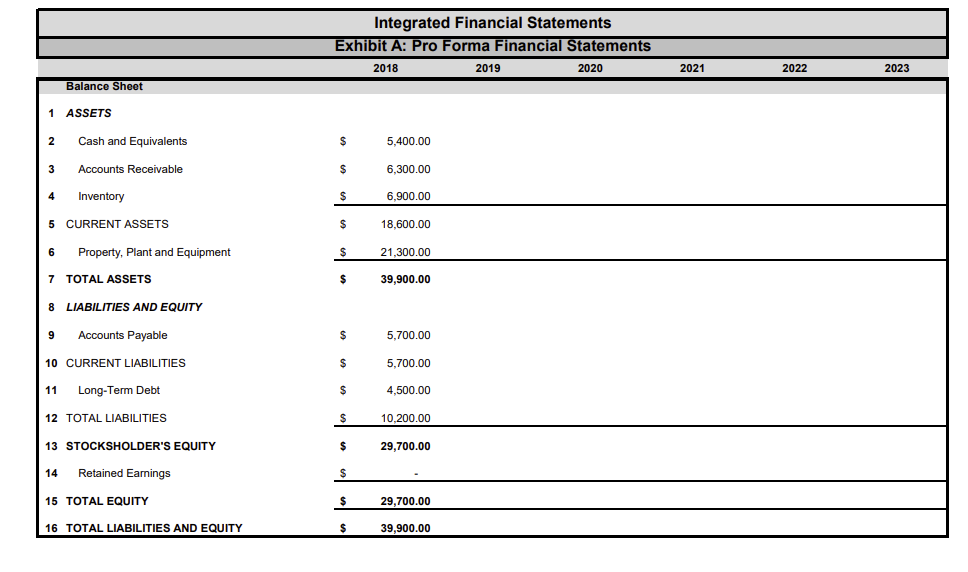
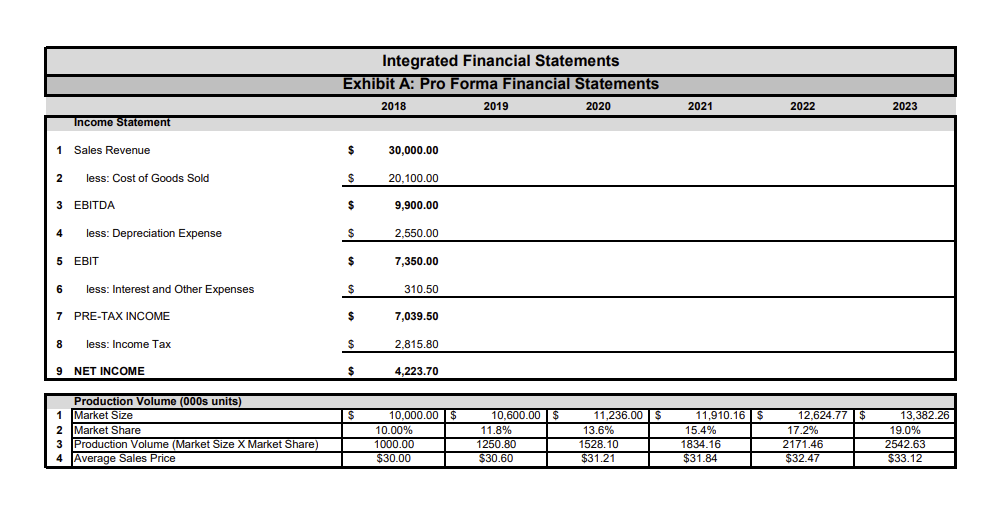
5) Exhibit A has the information about the change in production volume of sales for a company. This company will pay dividends on earnings of 20%. using the percent of sales method: a. What would be the inventory for 2023? b. What would be the new financing every year? (assuming that the new financing is coming from the existing equity holders) c. What would be the new financing for 2019 if the payout policy is 30% dividends? Integrated Financial Statements Exhibit A: Pro Forma Financial Statements 2018 2019 2020 2021 2022 2023 Balance Sheet 1 ASSETS 2 Cash and Equivalents $ 5,400.00 3 3 $ 6,300.00 4 Accounts Receivable Inventory 5 CURRENT ASSETS $ 6,900.00 $ 18,600.00 6 Property, Plant and Equipment $ 21,300.00 7 TOTAL ASSETS $ 39,900.00 8 8 LIABILITIES AND EQUITY 9 Accounts Payable $ 5,700.00 10 CURRENT LIABILITIES $ 5.700.00 11 Long-Term Debt $ 4,500.00 12 TOTAL LIABILITIES $ 10.200.00 13 STOCKSHOLDER'S EQUITY $ 29.700.00 14 Retained Earnings $ 15 TOTAL EQUITY $ 29,700.00 16 TOTAL LIABILITIES AND EQUITY $ 39,900.00 Integrated Financial Statements Exhibit A: Pro Forma Financial Statements 2018 2019 2020 2021 2022 2023 Income Statement 1 Sales Revenue $ 30,000.00 2 less: Cost of Goods Sold : $ 20,100.00 3 EBITDA $ 9,900.00 4 less: Depreciation Expense $ 2,550.00 5 EBIT $ 7,350.00 6 less: Interest and Other Expenses $ 310.50 7 PRE-TAX INCOME $ 7,039.50 8 less: Income Tax $ 2,815.80 9 NET INCOME $ 4,223.70 $ Production Volume (000s units) 1 Market Size 2 Market Share 3 Production Volume (Market Size X Market Share) 4 Average Sales Price 10,000.00 $ 10.00% 1000.00 $30.00 10,600.00 $ 11.8% 1250.80 $30.60 11,236.00 $ 13.6% 1528.10 $31.21 11,910.16 $ 15.4% 1834.16 $31.84 12,624.77 $ 17.2% 2171.46 $32.47 13,382.26 19.0% 2542.63 $33.12 5) Exhibit A has the information about the change in production volume of sales for a company. This company will pay dividends on earnings of 20%. using the percent of sales method: a. What would be the inventory for 2023? b. What would be the new financing every year? (assuming that the new financing is coming from the existing equity holders) c. What would be the new financing for 2019 if the payout policy is 30% dividends? Integrated Financial Statements Exhibit A: Pro Forma Financial Statements 2018 2019 2020 2021 2022 2023 Balance Sheet 1 ASSETS 2 Cash and Equivalents $ 5,400.00 3 3 $ 6,300.00 4 Accounts Receivable Inventory 5 CURRENT ASSETS $ 6,900.00 $ 18,600.00 6 Property, Plant and Equipment $ 21,300.00 7 TOTAL ASSETS $ 39,900.00 8 8 LIABILITIES AND EQUITY 9 Accounts Payable $ 5,700.00 10 CURRENT LIABILITIES $ 5.700.00 11 Long-Term Debt $ 4,500.00 12 TOTAL LIABILITIES $ 10.200.00 13 STOCKSHOLDER'S EQUITY $ 29.700.00 14 Retained Earnings $ 15 TOTAL EQUITY $ 29,700.00 16 TOTAL LIABILITIES AND EQUITY $ 39,900.00 Integrated Financial Statements Exhibit A: Pro Forma Financial Statements 2018 2019 2020 2021 2022 2023 Income Statement 1 Sales Revenue $ 30,000.00 2 less: Cost of Goods Sold : $ 20,100.00 3 EBITDA $ 9,900.00 4 less: Depreciation Expense $ 2,550.00 5 EBIT $ 7,350.00 6 less: Interest and Other Expenses $ 310.50 7 PRE-TAX INCOME $ 7,039.50 8 less: Income Tax $ 2,815.80 9 NET INCOME $ 4,223.70 $ Production Volume (000s units) 1 Market Size 2 Market Share 3 Production Volume (Market Size X Market Share) 4 Average Sales Price 10,000.00 $ 10.00% 1000.00 $30.00 10,600.00 $ 11.8% 1250.80 $30.60 11,236.00 $ 13.6% 1528.10 $31.21 11,910.16 $ 15.4% 1834.16 $31.84 12,624.77 $ 17.2% 2171.46 $32.47 13,382.26 19.0% 2542.63 $33.12
Step by Step Solution
There are 3 Steps involved in it

Get step-by-step solutions from verified subject matter experts