

Question: 5. Find the binomial coefficient. C=( 7 5) A.2520 B.3991680 C.21 D.10 E.792 6. Solve the word problem. There are 8 red, 5 blue, and
5.
Find the binomial coefficient. C=( 7 5)
A.2520
B.3991680
C.21
D.10
E.792
6.
Solve the word problem.
There are 8 red, 5 blue, and 2 green marbles in a hat. Without looking, you picked a blue marble. Without putting the blue marble back, what is the probability of picking a green marble?
A.2/13
B.2/15
C.1/3
D.1/7
E.1/14
7.
Solve the problems. Use the graph for the standard deviation points.
In a fishing contest, the length of the fish caught ranged from 11.5 inches to 23 inches with a mean length of 16.40 inches and standard deviation of 4.71 inches. Assume there was a normal distribution. What percent of the fish caught would have a length greater than 21.11 inches, one standard deviation above the mean?
A.2.1%
B.13.6%
C.84.1%
D.15.9%
E.0.2%
10.
Choose the best answer.
The mean of the winning scores of a bowling tournament over the last 10 years was 279, with a standard deviation of 3. Considering that the scores were in a normal distribution, how many scores were below 282?
A.6
B.8
C.5
D.2
E.10
3.
Choose the best answer.
Four hundred raffle tickets were sold for $4 each. The one first prize winner will receive $300, and two people will each receive second prizes of $200. There will be three $100 winners. What will be the expected value of the raffle?
A.$2.50
B.-$4.00
C.$4.00
D.$1.50
E.-$1.50
5.
Choose the best answer.
Sammi plans on selling Christmas tree ornaments. She figured a profit of $2.00 for each item. She thinks one item out of every fifty may be defective and returned for exchange. That will cost her $7.00 because of shipping and cost of the replacement. Calculate the expected value.
A.$0.18
B.$1.82
C.-$2.18
D.$2.18
E.-$1.82
7.
Choose the best answer.
Hover-High Helicopters manufactures radio-controlled toy helicopters. They have their quality control down to a point where only 1 in 100 built could be defective and returned for repair at a cost to the company of $50. At a profit margin of $10 per unit, what would their profit be per unit after selling 200 copters?
A.$9.40 per unit
B.-$9.40 per unit
C.$10.00per unit
D.-$0.60per unit
E.$0.60per unit
6.
Choose the best answer.
In a high school high jump contest, the height of clearing the bar ranged from 71 inches to 84 inches. The mean height was 76 inches and the standard deviation was 3.5 inches. What percent of the jumpers were in the group jumping below 79.5 inches? (HINT:How many standard deviations is 79.5 inches?)
A.15.9%
B.2.1%
C.84.1%
D.34.1%
E.13.6%
8.
Solve the problem for the compound events.
You pick a card from a deck containing 5 cards and roll a 6-sided die. How many outcomes are possible?
A.9
B.30
C.5
D.11
E.6
14.
Solve the problem for probability to 4 decimal places.
A bag contains 12 blue, 9 green, and 6 yellow marbles. Without looking, what is the probability of picking a green marble?
A.918
B.118
C.13
D.127
E.19
19.
Find the probability of success to 4 decimal places. Use a calculator if needed.
What is the probability of getting 3 heads out of 10 tries, flipping a coin?
A.0.5000
B.0.7000
C.0.1500
D.0.1172
E.0.3000
3.
Solve the problem for the compound events.
You have 4 cards and a spinner with 5 numbers on it. How many combinations are possible?
A.20
B.12
C.5
D.4
E.9
8.
Find the probability of success to 4 decimal places. Use a calculator if needed.
What is the probability of getting 9 heads out of 15 tries, flipping a coin?
A.0.1527
B.0.3000
C.0.4000
D.0.6000
E.0.0003
12.
Choose the best answer.
A company produces toy cars of all colors. Three out of every 200 cars have to be rejected because of imperfections. It costs $2.00 per car to replace them. The profit margin is $1.00 per car. What would the profit per car be selling 600 cars?
-104.5
cents
4.5
cents
-95.5
cents
104.5
cents
95.5
cents
9) In the telemarketing industry, the success rate is one call in one hundred resulting in a sale. What is the probability of a telemarketer making 5 sales in 100 calls?
0
0.05
0.385
0.0059
0.0029
10) In the telemarketing industry, the success rate is one call in one hundred resulting in a sale. What is the probability of a telemarketer making no sales in 100 calls?
0.5
0.366
0.0029
0
0.0059
11) A manufacturer of bicycle parts finds that they have a defect rate of 6.7%. What is the probability that in a production run of 124 parts that they will find 10 defective parts?
0.674
0.018
0.0674
0.11
0.00037
12) A manufacturer of bicycle parts finds that they have a defect rate of 0.62%. What is the probability that in a production run of 124 parts that they will find 10 defective parts?
4.
Round to the nearest hundredth.
A die was rolled 60 times. It landed on one?11 times, two?9 times, four?12 times, five?12 times, and six?8 times. How many times was three rolled in these 60 times?
3
52
60
12
8
5.
Round to the nearest hundredth.
A die was rolled 60 times. It landed on one?11 times, two?9 times, four?12 times, five?12 times, and six?8 times. What is the empirical probability of rolling a 5?
0.20
0.012
0.5
0.12
0.05
8.
Round to the nearest hundredth.
A coin is flipped 2,500 times. It lands on heads 1,223 times and tails 1,277 times. What is the empirical probability of getting tails on this coin?
0.25
0.51
0.1277
0.5
10.
Round to the nearest hundredth.
A die was rolled 60 times. It landed on one?11 times, two?9 times, four?12 times, five?12 times, and six?8 times.. What is the empirical probability of rolling an odd number?
3/60
0.48
0.50
0.52
3/6
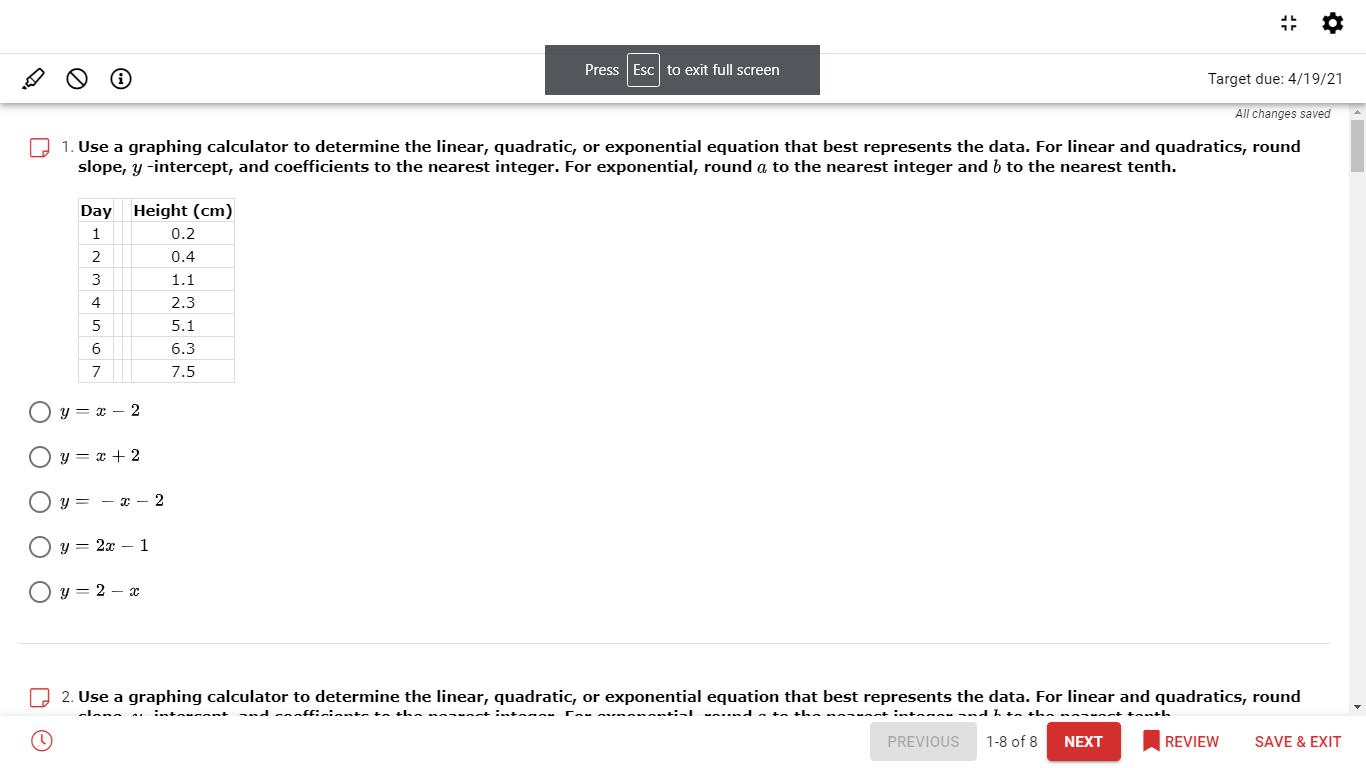
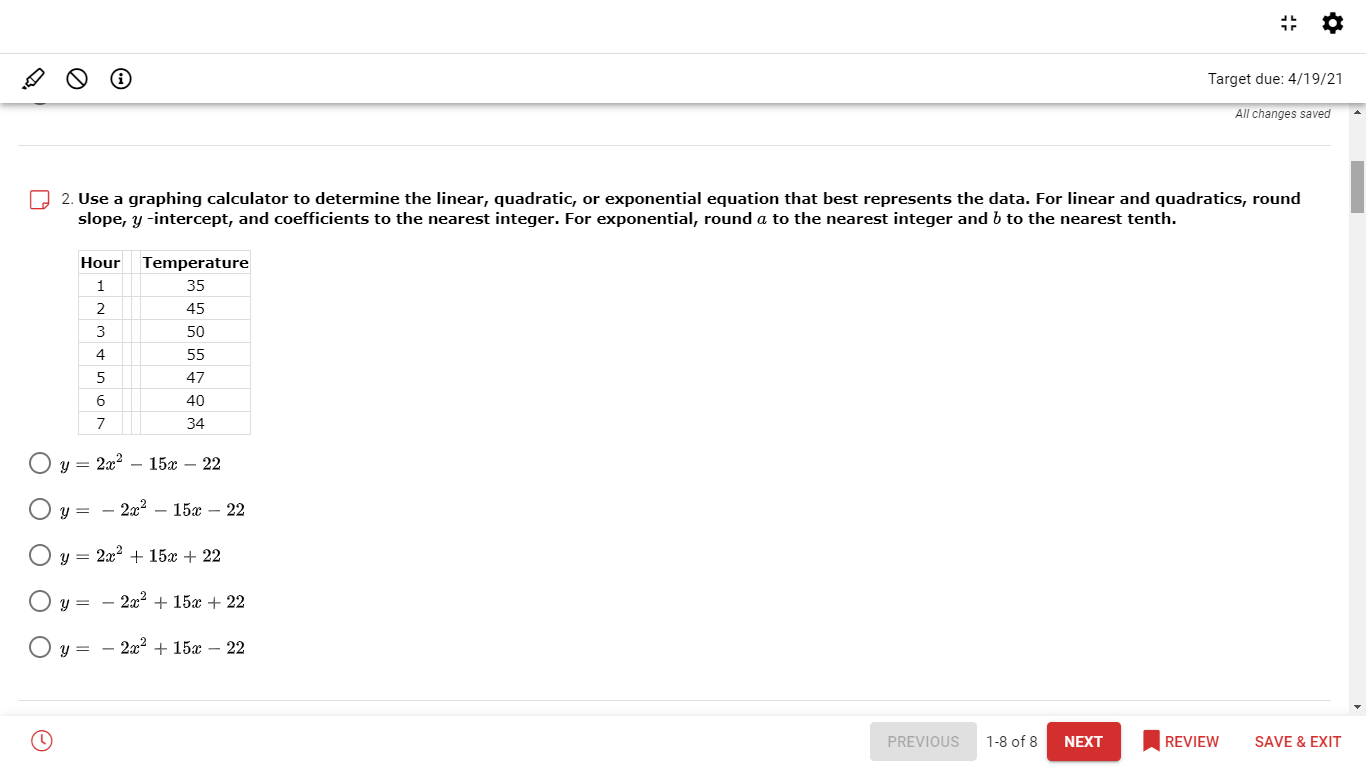
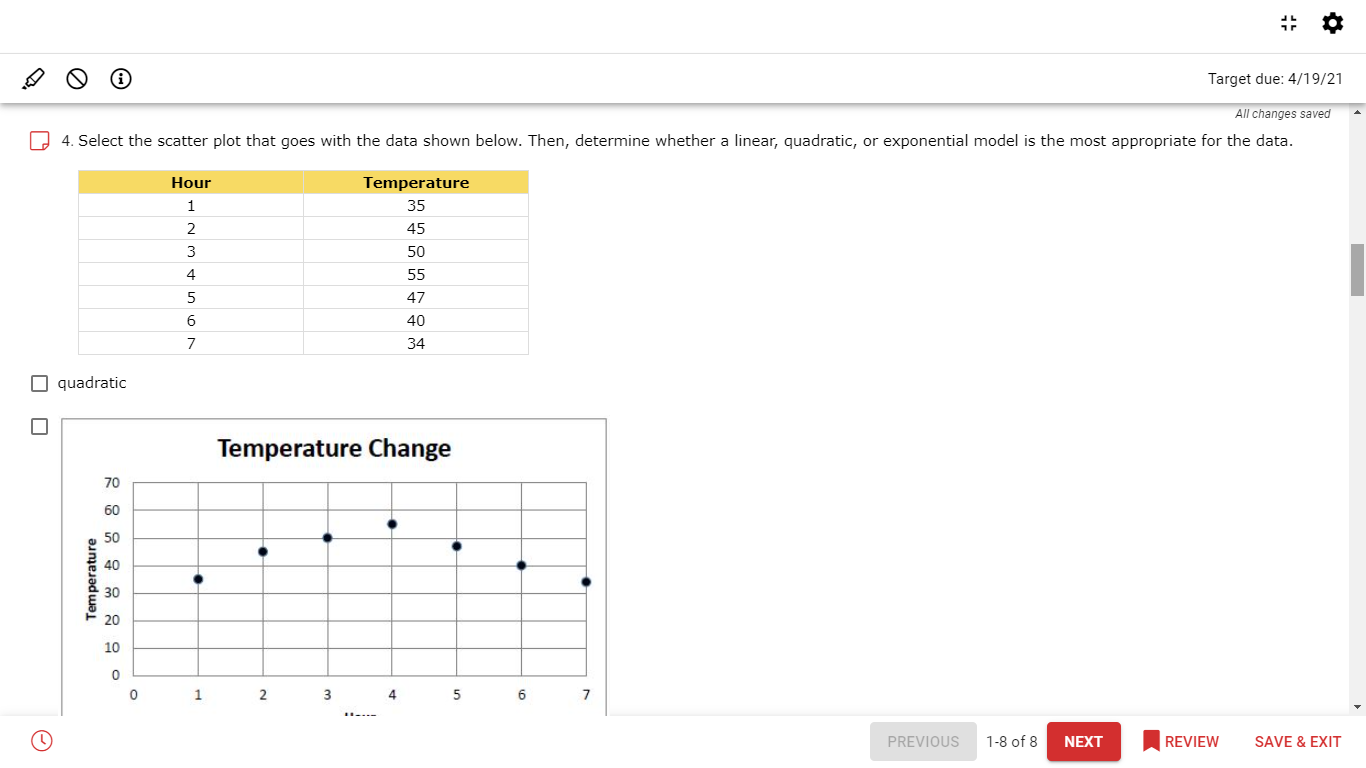
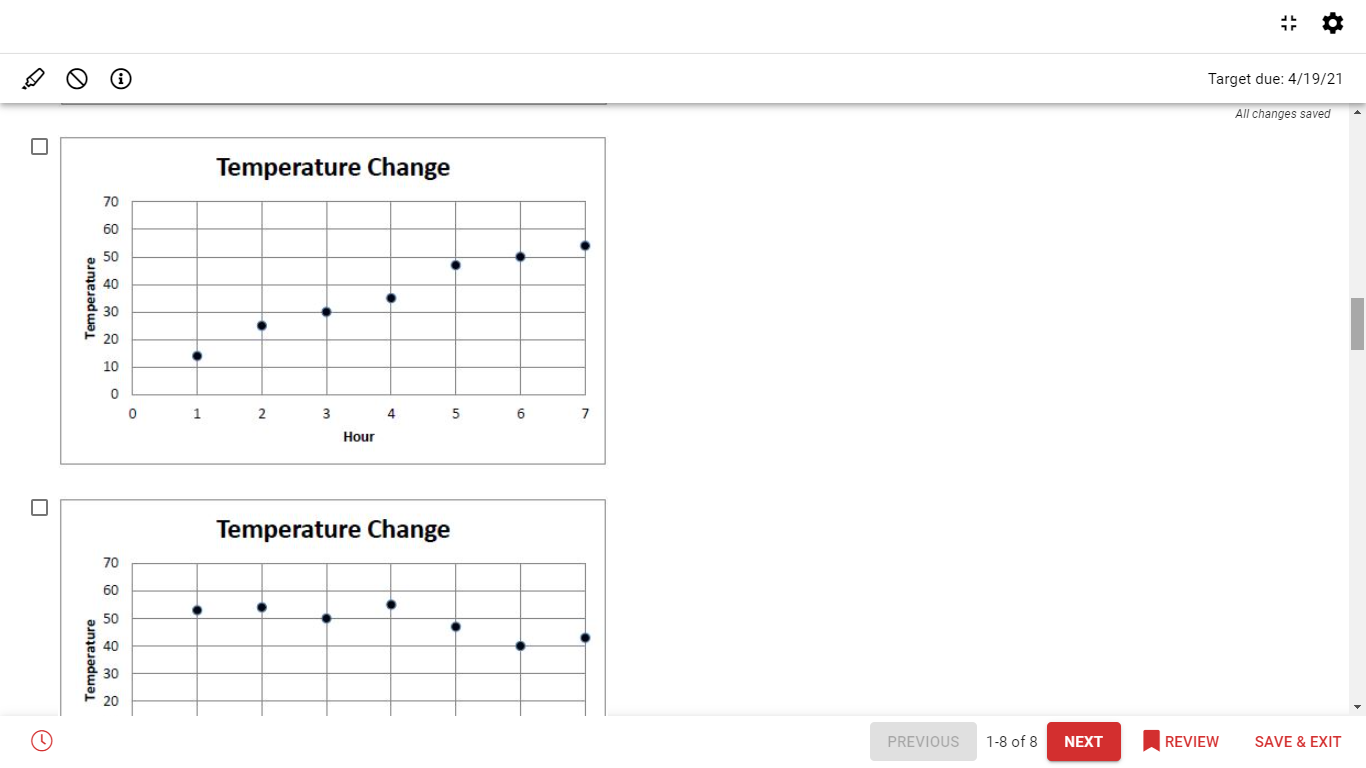
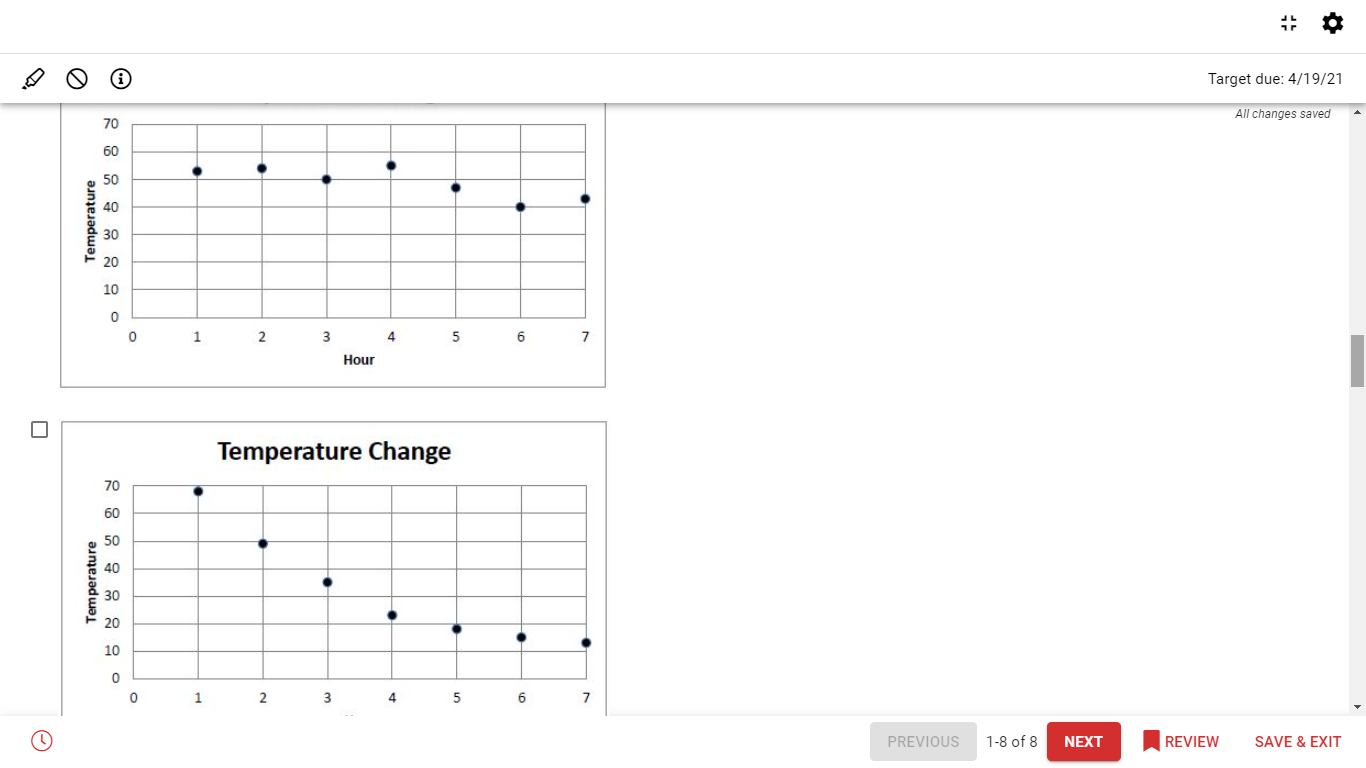
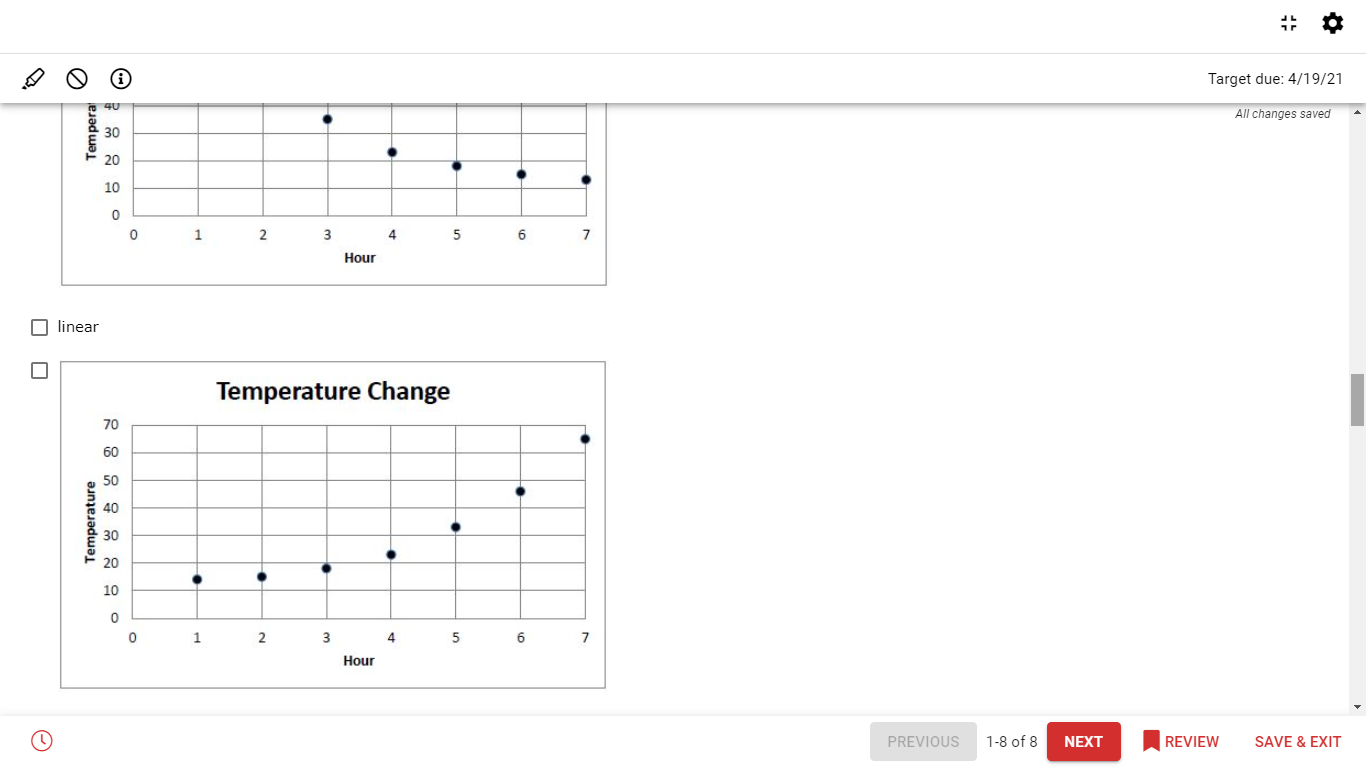
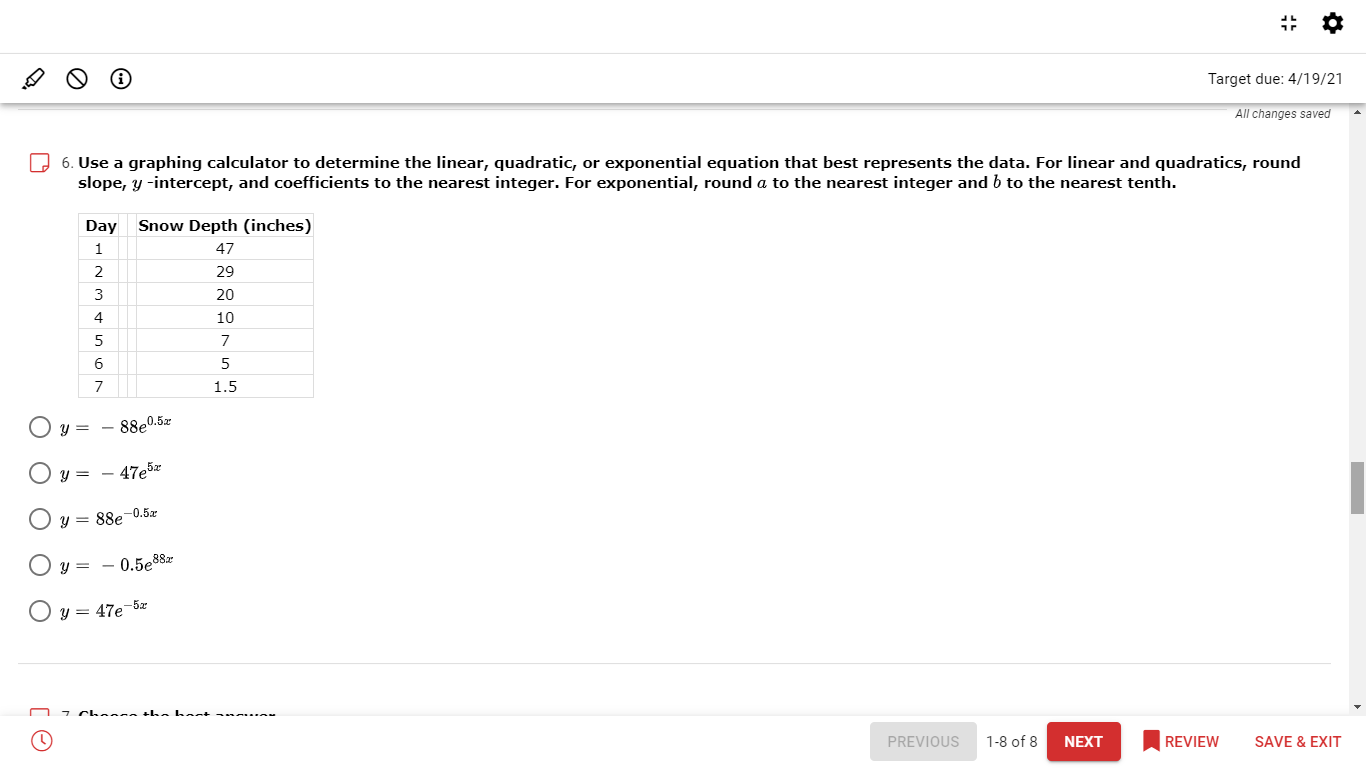
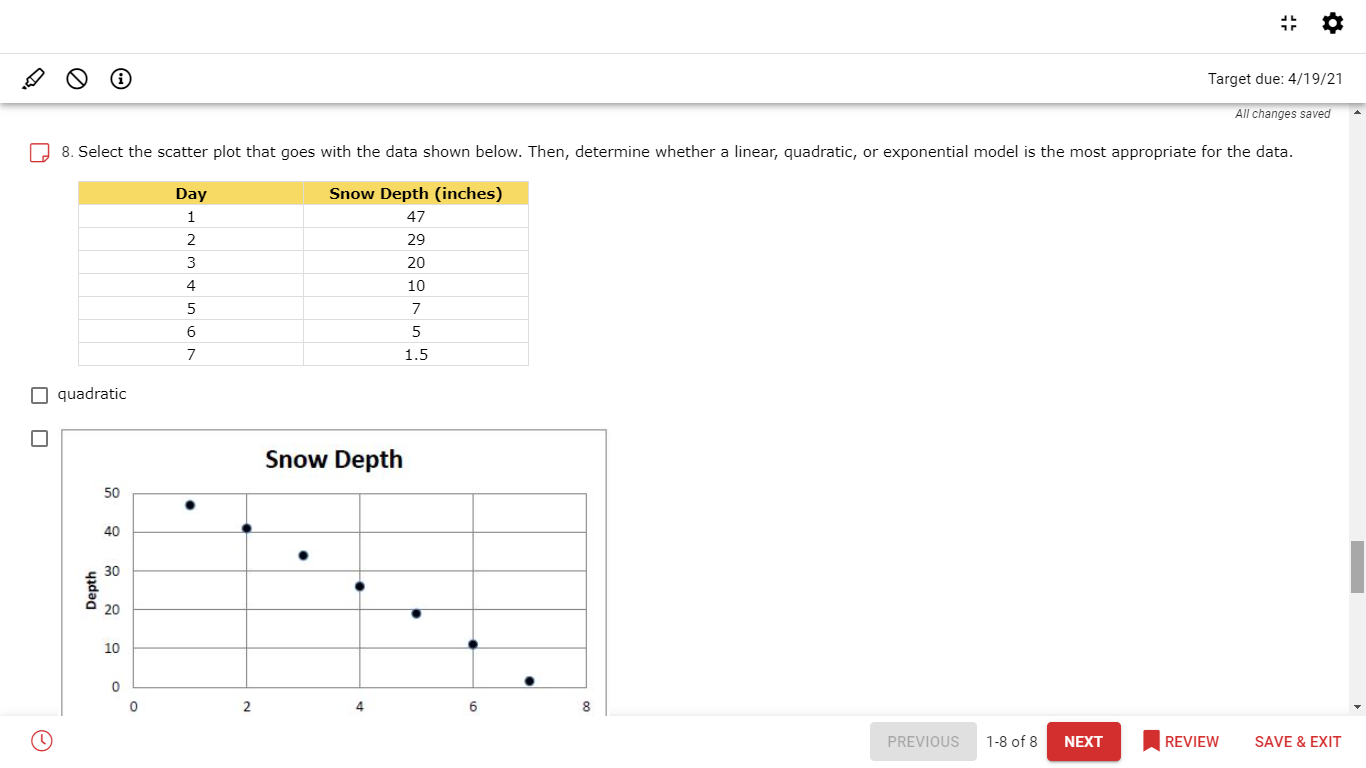
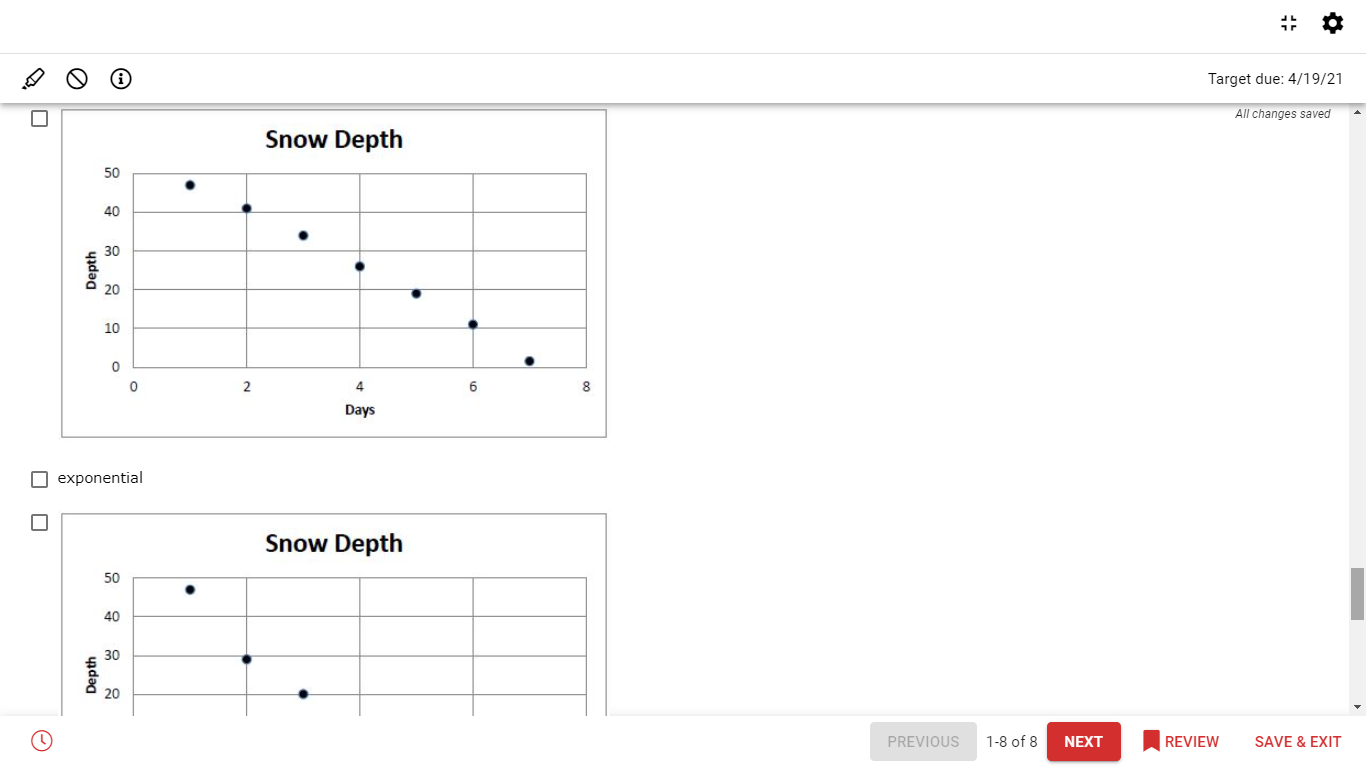
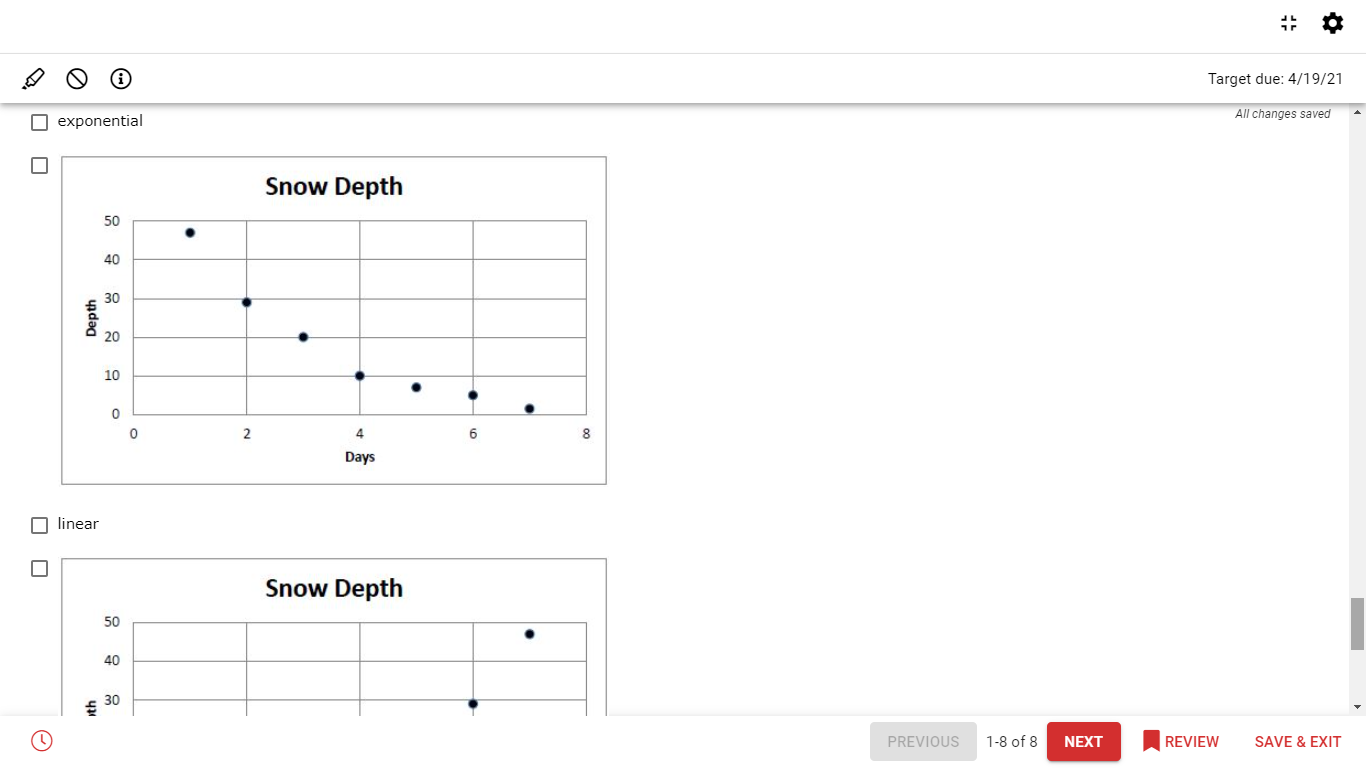
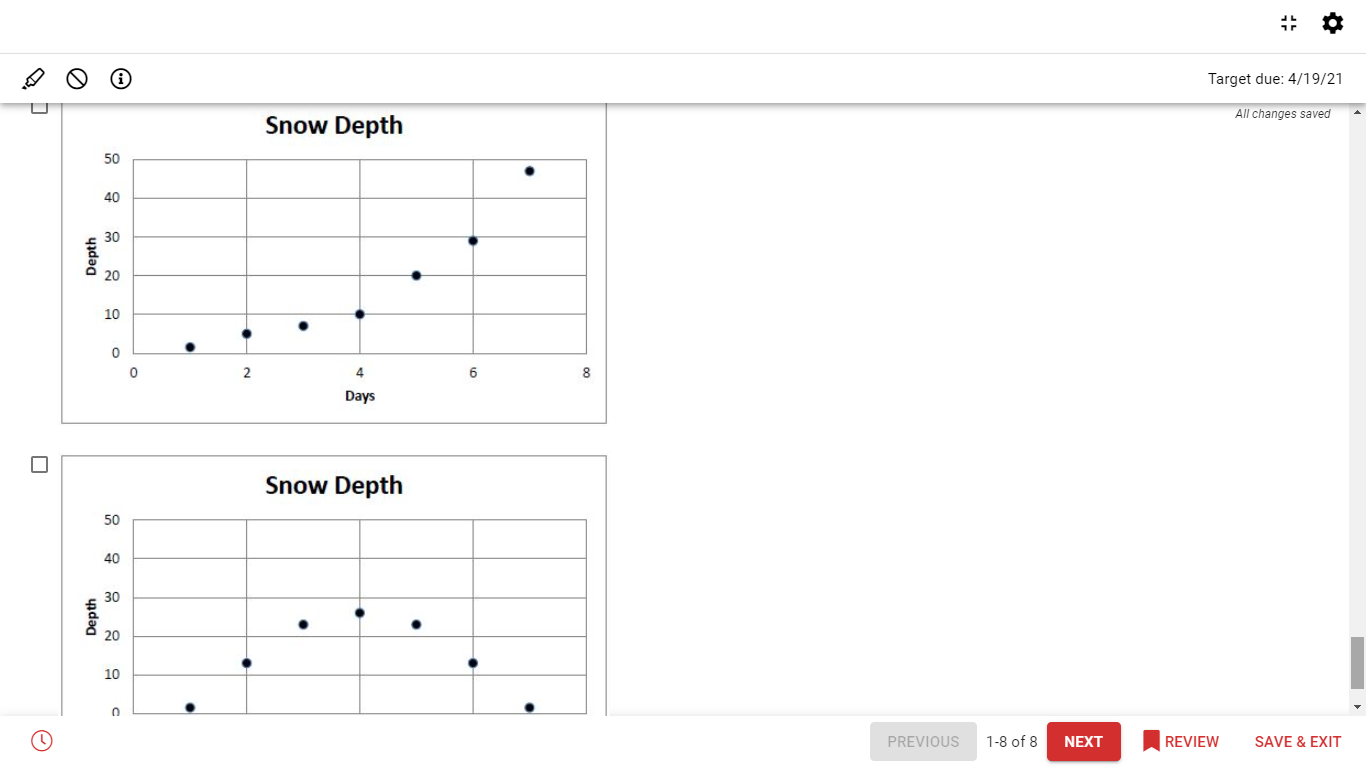
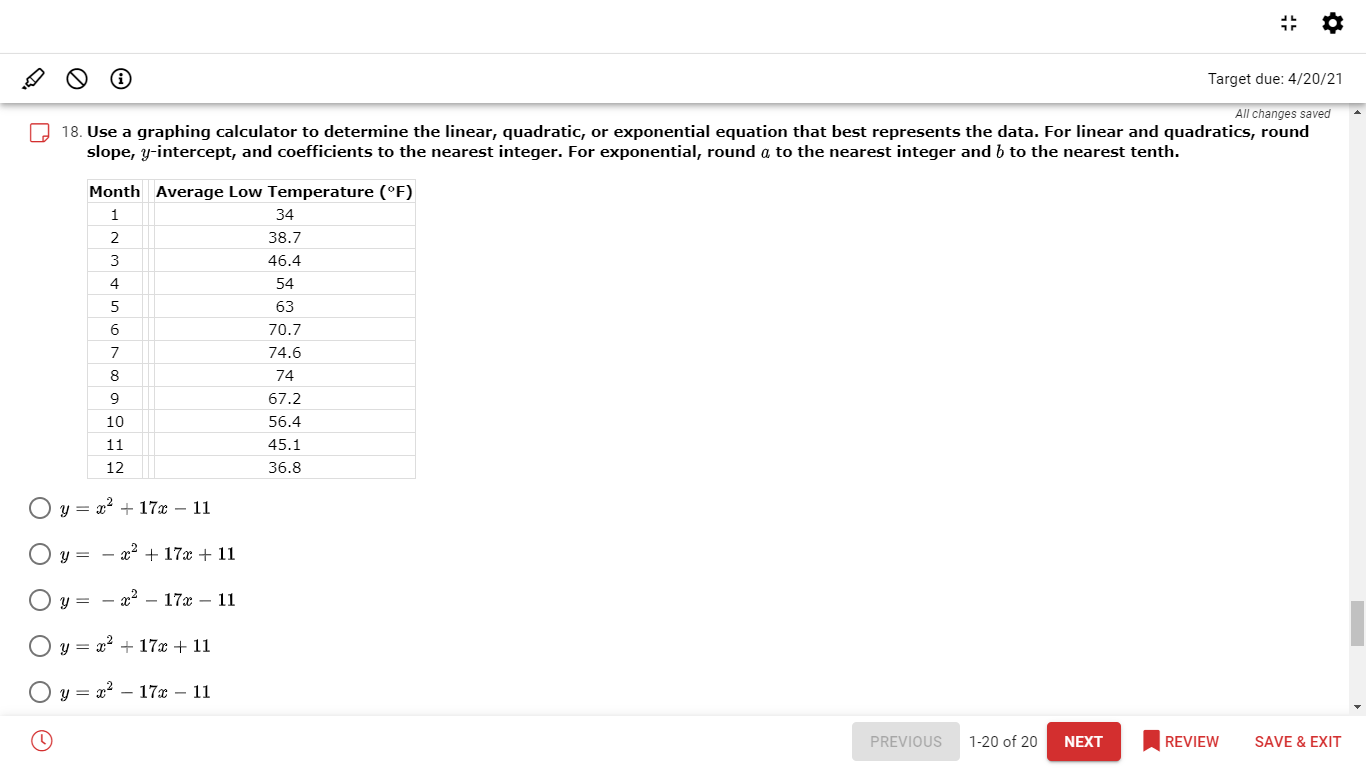
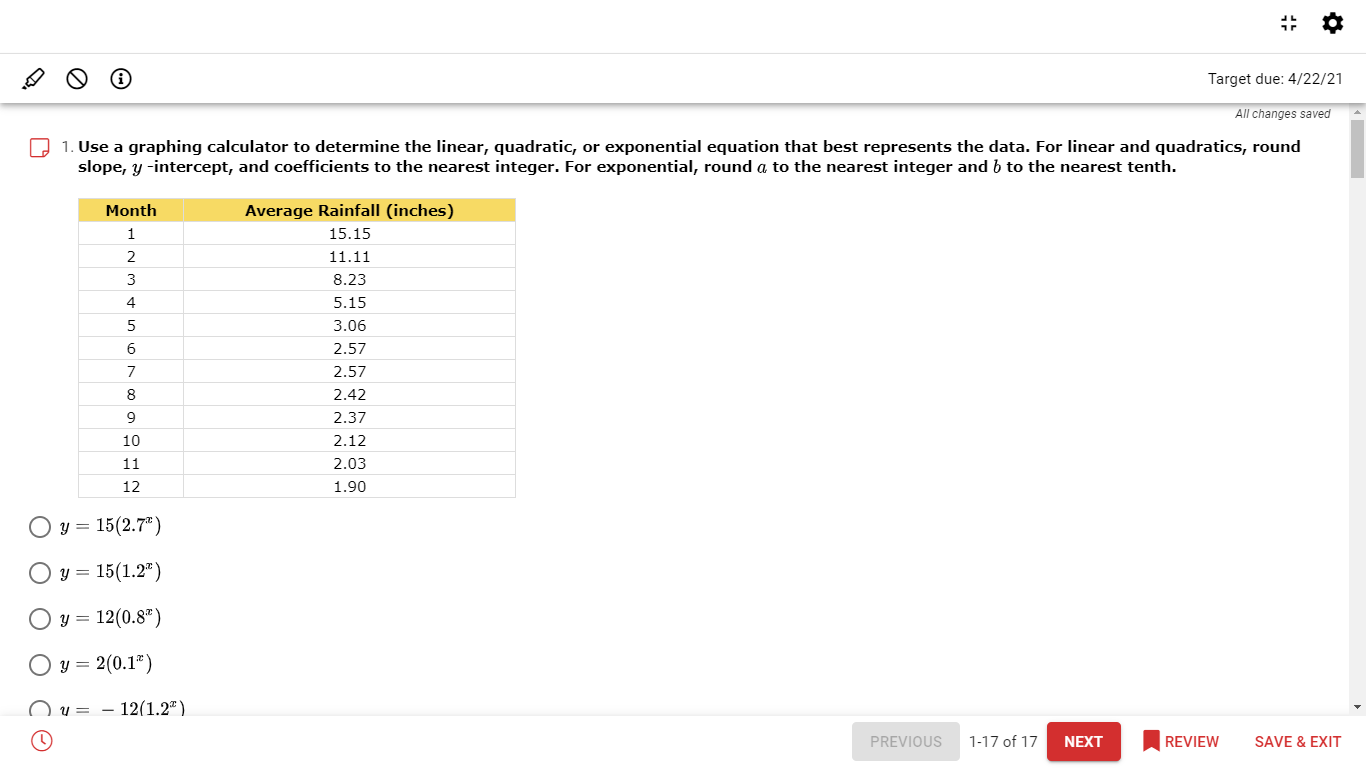
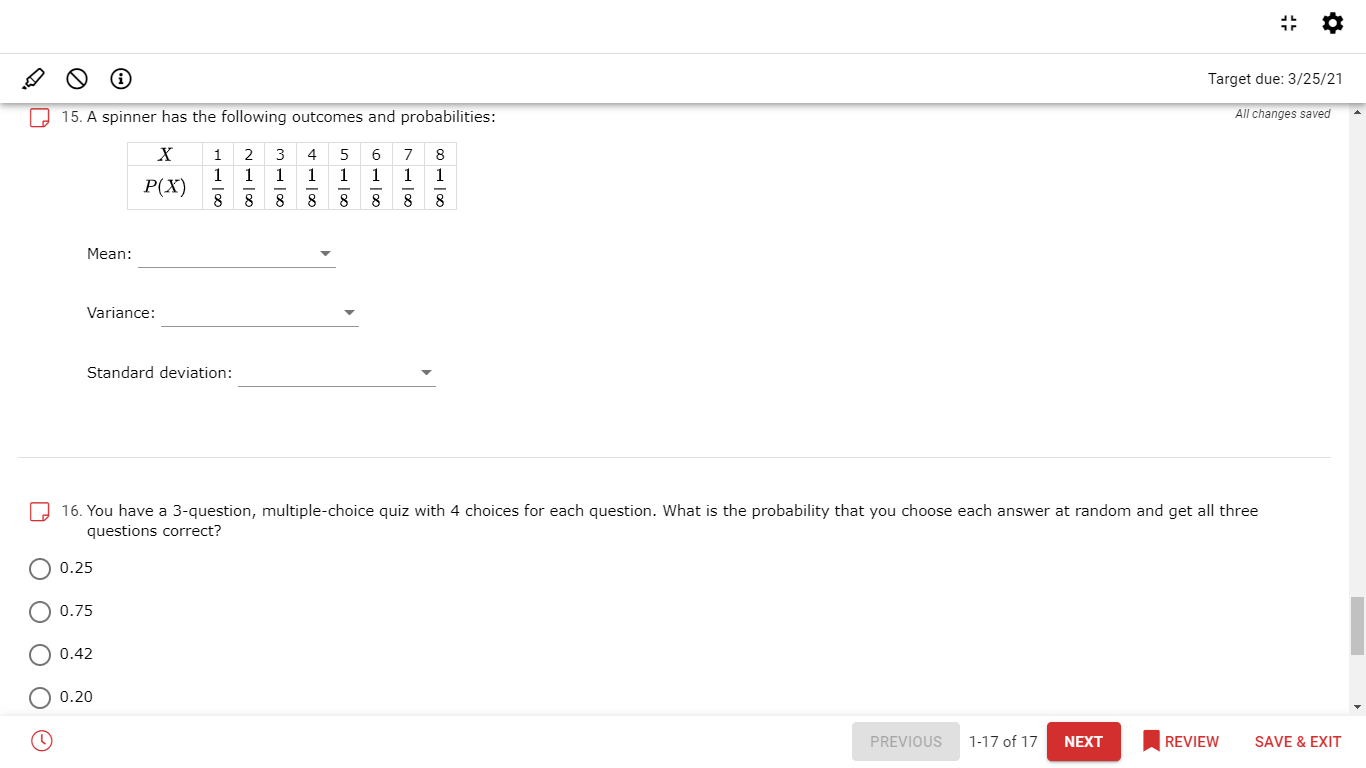
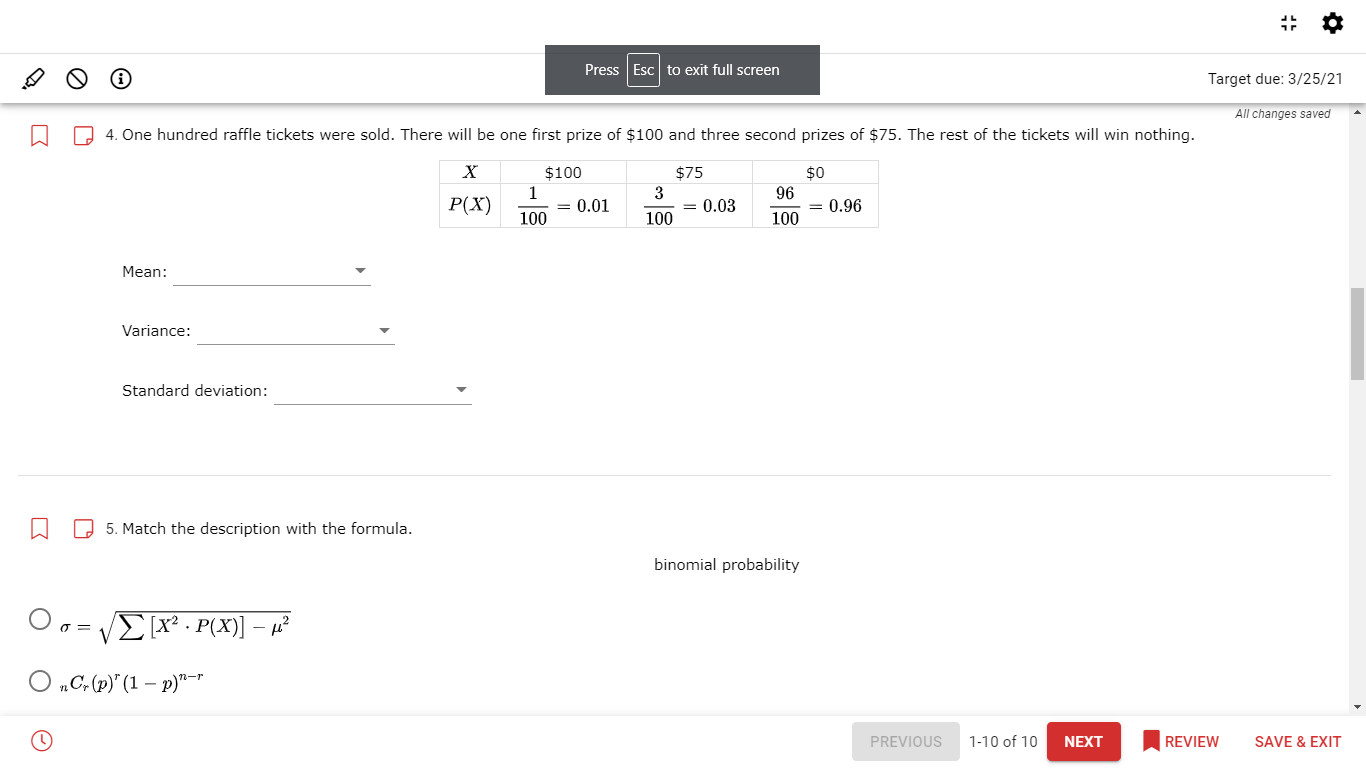
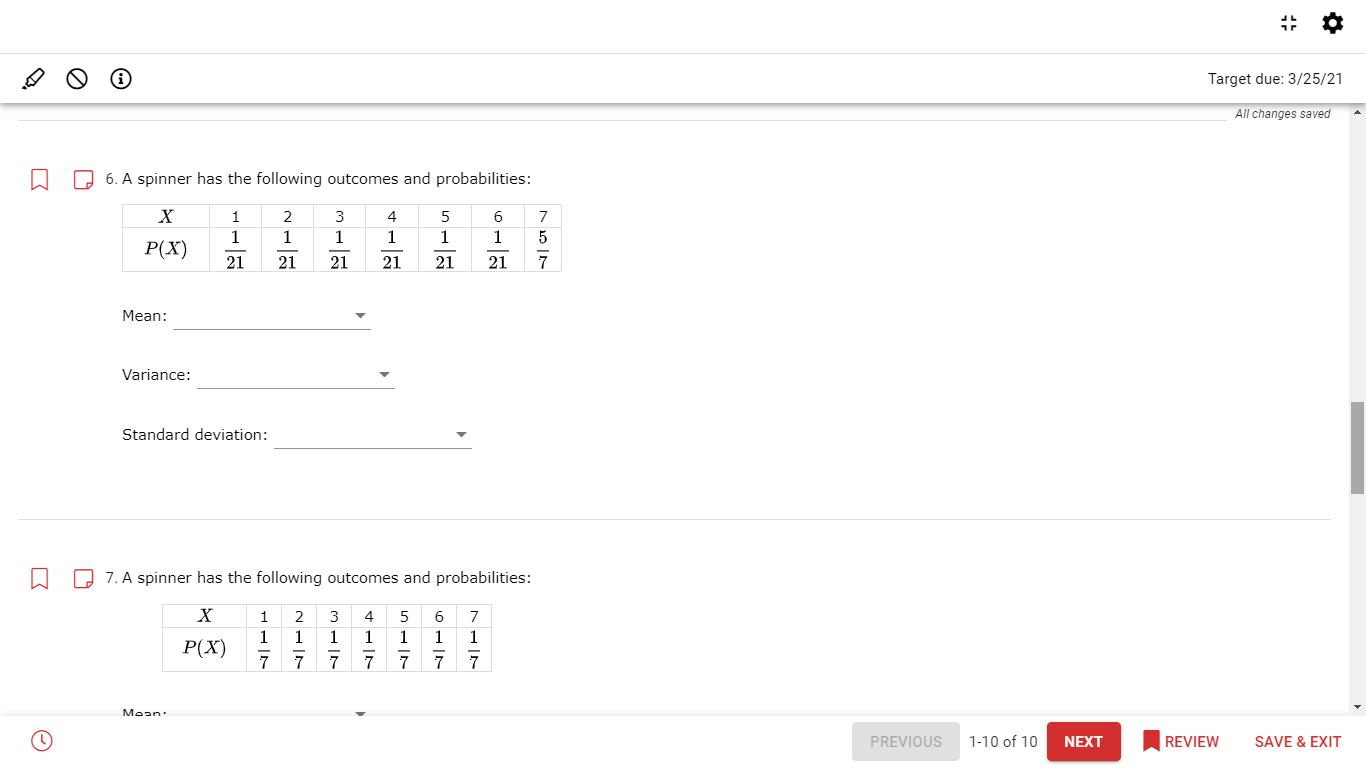
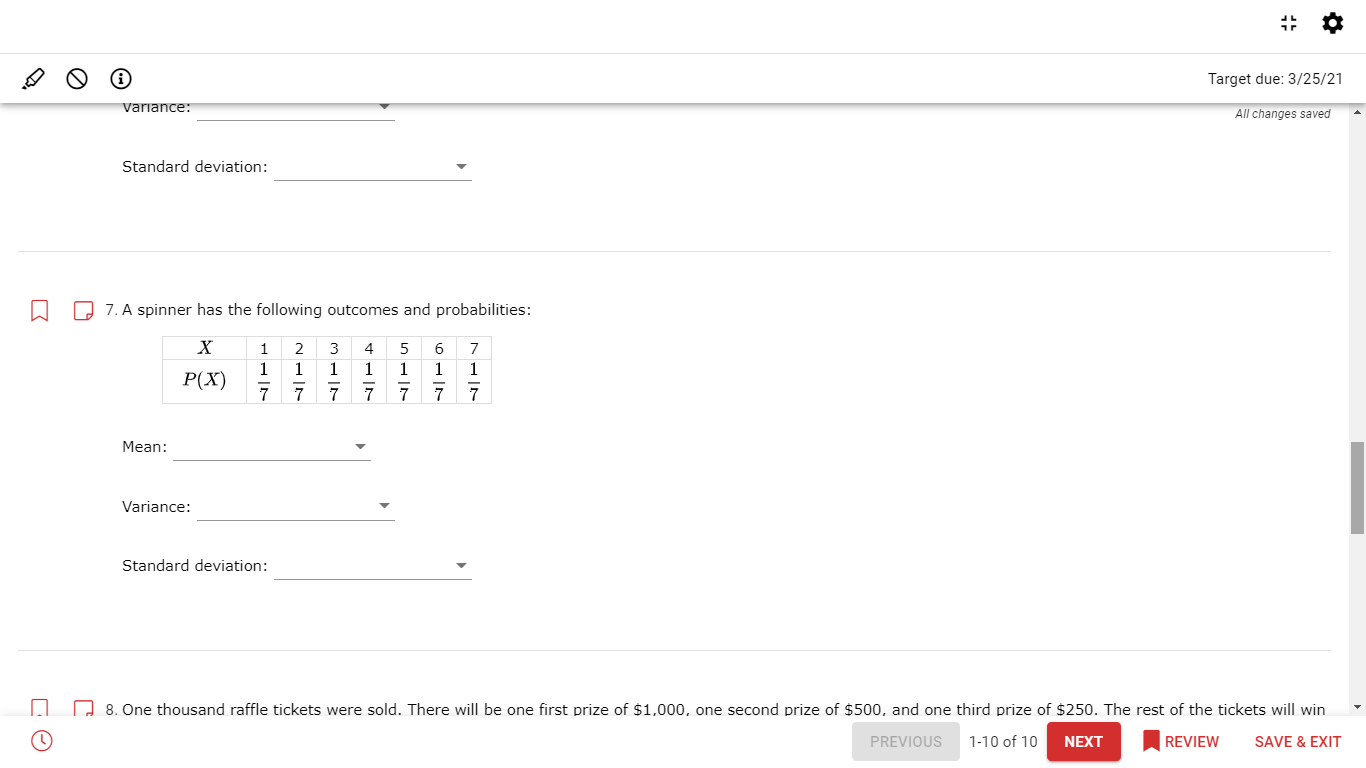
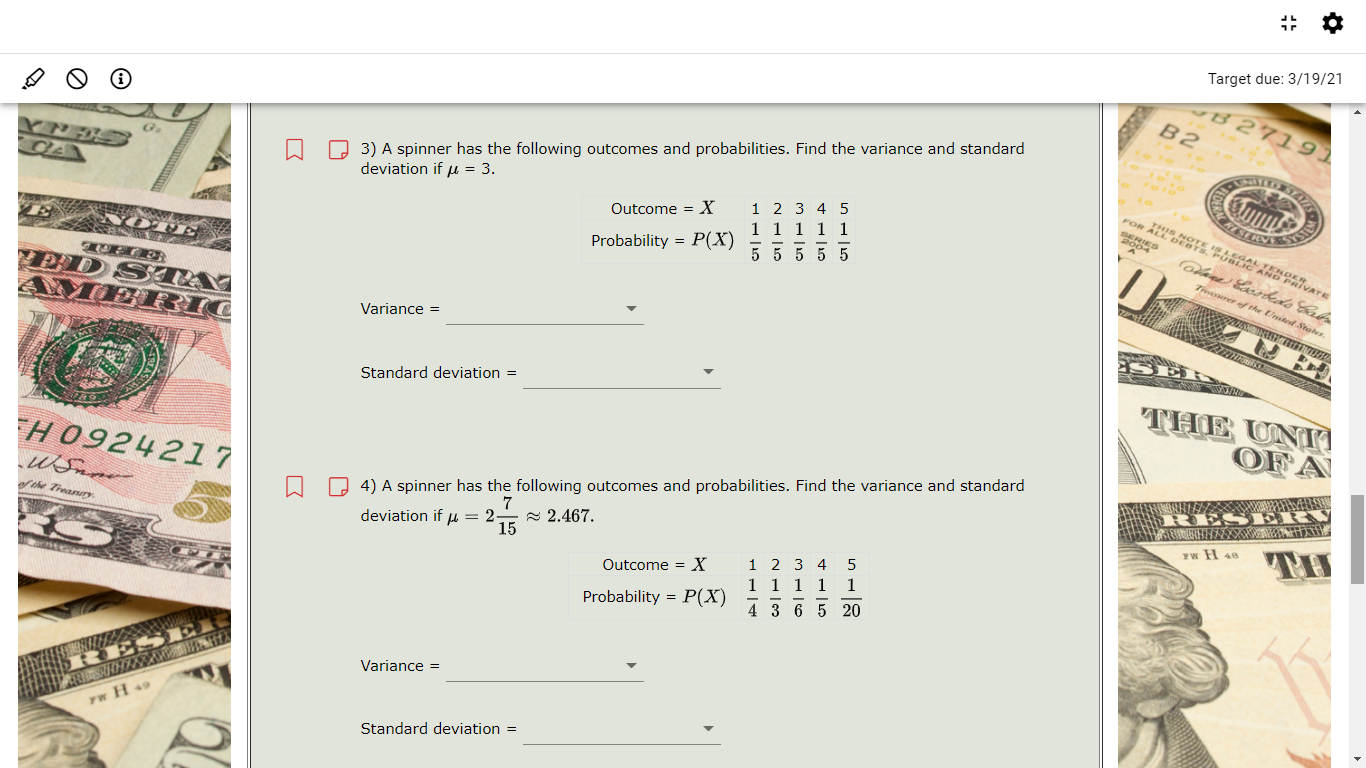
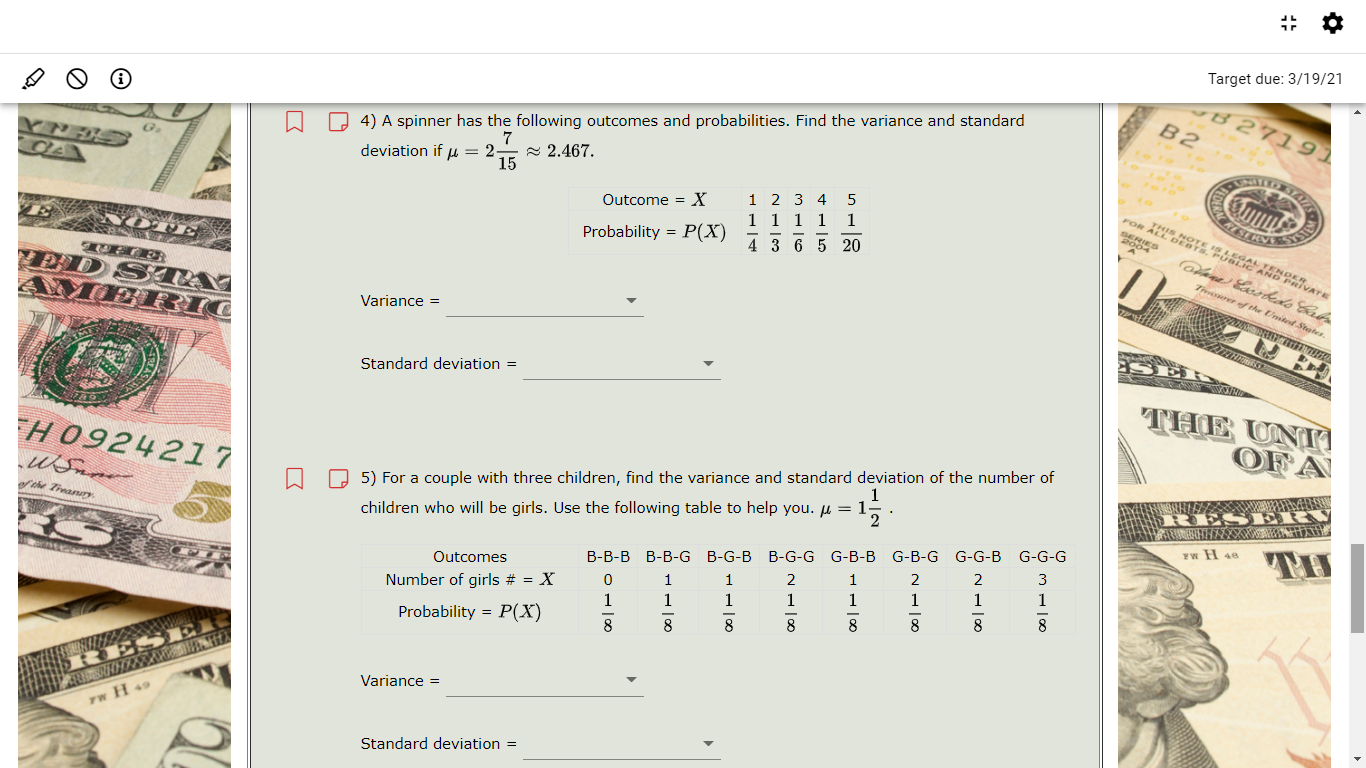
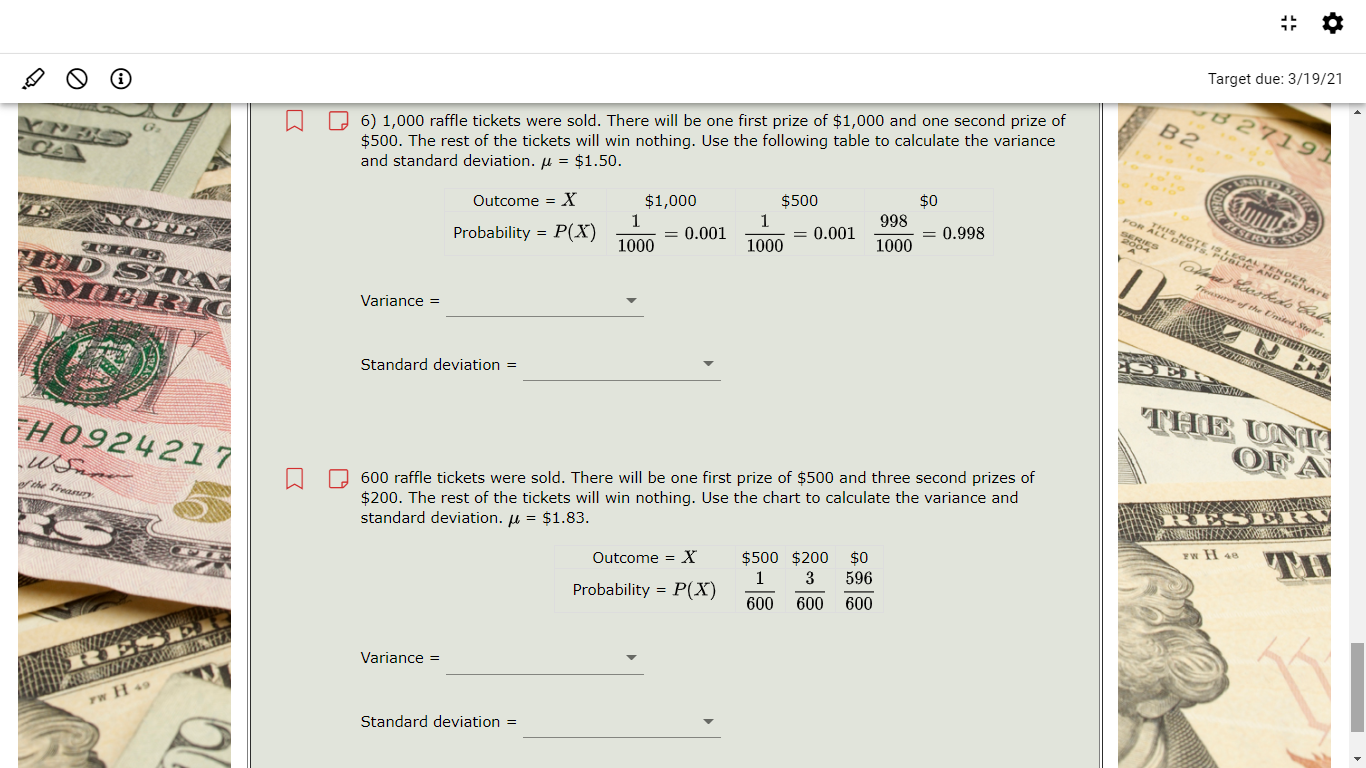
.IQGG) Target due: 4/19f2'l AH changes saved D 1. Use a graphing calculator to determine the linear, quadratic, or exponential equation that best represents le data. For linear and quadratics, round slope, y fintereept, and coefficients to the nearmt integer. For exponential, round a, to the nearest integer and b to the nearest tenth. Day Height (cm) 1 NJhU'l-BUJN 0.2 0.4 1.1 2.3 5.1 6.3 7.5 D 2. Use a graphing calculator to determine the linear, quadratic, or exponential equation that best represents the data. For linear and quadratics, round ..I...... .. :.4.......... -...I ......u:..:....;.. l" e1... -nj-....; :...._...__ r..- .._._......_.;:'I -...._..I .. g.. u... _____ .4 :..;......_ -...I I. 4.. e1... ....--n... 4..-;1. I REVIEW SAVE E. EXIT CD PREVIOUS 178 CH) NEXT I? G (9 Target due: 4l19l2'l AH changes saved ' D 2. Use a graphing calculator to determine the linear, quadratic, or exponential equation that best represents the data. For linear and quadratics, round I slope, y -intercept, and coefficients to the nearest integer. For exponential, round a. to the nearest integer and TI to the nearest tenth. Hour Temperature 1 35 45 50 55 47 40 34 \\l'U'l--WN Oy=2m'15m22 Oy= 2m215:1:22 Oy=2m2+15m+22 09: 222+15m+22 0g: 2w2+15m22 (9 PREVIOUS Hz ON) NEXT I REVIEW SAVE s. EXIT Target due: 4/19/21 All changes saved 4. Select the scatter plot that goes with the data shown below. Then, determine whether a linear, quadratic, or exponential model is the most appropriate for the data. Hour Temperature 35 45 WNH 50 55 47 40 34 quadratic 0 Temperature Change 70 60 Temperature 8 8 8 8 10 O 1 2 3 5 6 7 PREVIOUS 1-8 of 8 NEXT REVIEW SAVE & EXITTarget due: 4/19/21 All changes saved Temperature Change 70 60 8 8 8 8 Temperature 10 O 0 1 2 3 4 5 6 7 Hour 0 Temperature Change 70 60 Temperature PREVIOUS 1-8 of 8 NEXT REVIEW SAVE & EXITO Target due: 4/19/21 All changes saved 70 50 50 Temperature 10 O 0 1 2 3 4 5 6 7 Hour Temperature Change 70 8 8 8 8 Temperature 20 10 O 0 1 2 3 4 5 6 PREVIOUS 1-8 of 8 NEXT REVIEW SAVE & EXITO Target due: 4/19/21 40 All changes saved Tempera 30 20 10 0 0 1 2 3 4 5 6 7 Hour linear 0 Temperature Change 70 60 Temperature 10 O 0 1 2 3 4 5 6 7 Hour PREVIOUS 1-8 of 8 NEXT REVIEW SAVE & EXITI? G (9 Target due: 4l19l2'l AH changes saved ' D 6. Use a graphing calculator to determine the linear, quadratic, or exponential equation that best represents the data. For linear and quadratics, round slope, y -intercept, and coefficients to the nearest integer. For exponential, round a. to the nearest integer and b to the nearmt tenth. Day Snow Depth (inches) 1 47 29 20 10 7 5 1.5 NONLn-Pllh O y = 886\"\" O y = 47625\" I O y : 88905\" 0 y = _ 0.58832 0 y = 4765\" l\\ 7 nL-...1.. an... 1...... _______ (9 PREVIOUS Hz ON) NEXT I REVIEW SAVE s. EXIT Target due: 4/19/21 All changes saved 8. Select the scatter plot that goes with the data shown below. Then, determine whether a linear, quadratic, or exponential model is the most appropriate for the data. Day Snow Depth (inches) 47 IN 29 3 20 4 10 5 7 5 1.5 quadratic Snow Depth 50 30 Depth 20 10 0 2 4 6 8 PREVIOUS 1-8 of 8 NEXT REVIEW SAVE & EXITO Target due: 4/19/21 All changes saved Snow Depth 50 30 Depth 20 10 0 2 4 6 8 Days exponential Snow Depth 50 40 30 Depth 20 PREVIOUS 1-8 of 8 NEXT REVIEW SAVE & EXITTarget due: 4/19/21 exponential All changes saved Snow Depth 50 30 Depth 20 10 2 4 6 8 Days linear Snow Depth 50 40 30 PREVIOUS 1-8 of 8 NEXT REVIEW SAVE & EXITTarget due: 4/19/21 Snow Depth All changes saved 50 40 30 Depth 20 10 0 0 2 4 6 8 Days 0 Snow Depth 50 40 30 Depth 20 10 0 PREVIOUS 1-8 of 8 NEXT REVIEW SAVE & EXITO Target due: 4/20/21 All changes saved 18. Use a graphing calculator to determine the linear, quadratic, or exponential equation that best represents the data. For linear and quadratics, round slope, y-intercept, and coefficients to the nearest integer. For exponential, round a to the nearest integer and b to the nearest tenth. Month Average Low Temperature (OF) 1 34 38.7 W N 46.4 4 54 5 63 6 70.7 7 74.6 74 67.2 10 56.4 11 45.1 12 36.8 Oy = x' +17x - 11 Oy= - 2 + 17xe + 11 Oy= - x2 -17x - 11 Oy=x' +17x + 11 Oy=x2 -17x - 11 PREVIOUS 1-20 of 20 NEXT REVIEW SAVE & EXITI? G (9 Target due: 4722,!21 AH changes saved ' D 1. Use a graphing calculator to determine the linear, quadratic, or exponential equation that best represents le data. For linear and quadratics, round Slope, y fintereept, and coefficients to the nearmt integer. For exponential, round a to the nearest integer and b to the nearest tenth. Month Average Rainlall (indlm) 1 15.15 2 11.11 3 3.23 4 5.15 5 3.06 6 2.57 7 2.57 8 2.42 9 2.37 10 2.12 11 2.03 12 1.90 O y : 15(2?) 0 y = 15(1.2m) O y : 12(03') 0 y = 2(0-1\") (\"1 t: = 12(12\" ' (9 PREVIOUS H7 of 17 NEXT I REVIEW SAVE s. EXIT 19 G (D Target due: 3(25l2'l D 15. A spinner has the following outcomes and probabilities: AHCPIBHDESSBVM ' X 123456?8 130011111111 88888888 Mean: V Variance: ' Standard deviation: V D 16. You have a 3question, multiplechoice quiz with 4 choices for each question. What is the probability that you choose each answer at random and get all three questions correct? 6) PREVIOUS H 1 of 1? NEXT I REVIEW SAVE a. EXIT Press Esc | to exit full screen Target due: 3/25/21 All changes saved Q 4. One hundred raffle tickets were sold. There will be one first prize of $100 and three second prizes of $75. The rest of the tickets will win nothing. X $100 $75 $0 P(X) 1 3 96 = 0.01 = 0.03 = 0.96 100 100 100 Mean: Variance: Standard deviation: 5. Match the description with the formula. binomial probability O .= [ x2 . P(X)] - 12 O n Cr(p)' (1 - p)-r PREVIOUS 1-10 of 10 NEXT REVIEW SAVE & EXIT19 G (D Target due: 3(25l2'l All changes saved ' E] D 6. A spinner has the following outcomes and probabilities: X 1 2 3 4 5 6 7 m} 1 1 i L i i i 21 21 21 21 21 21 7 Mean: ' Variance: V Standard deviation: V El D 3". A spinner has the following outcomes and probabilities: X 1 2 3 4 5 6 7 P(X) l l l l l l l 7 7 7 7 7 7 7 Mann- ' ' PREVIOUS H 0 of 10 NEXT I REVIEW SAVE a. EXIT O Target due: 3/25/21 variance: All changes saved Standard deviation: W 7. A spinner has the following outcomes and probabilities: X 2 4 6 7 HW P(X) Mean: Variance: Standard deviation: . 8. One thousand raffle tickets were sold. There will be one first prize of $1,000, one second prize of $500, and one third prize of $250. The rest of the tickets will win PREVIOUS 1-10 of 10 NEXT REVIEW SAVE & EXITE] D 3) A spinner has the following outcomes and probabilities. Find Hie variance and standard deviation ify. = 3. Outcome = X Standard deviation = deviation if p = 21; F8 2.467. Outcome : X Probabiiity=P(X) _ _ _ Standard deviation = V Probability: P(X) E E _ 4) A spinner has the following outcomes and probabilities. Find the variance and smndard E] El D 4) A spinner has the following outcomes and probabilities. Find Hie variance and standard 7 d ' ' 'f = . . evratlonl p 215 :3 2 467 Outcome = X Probability:P(A') _ _ _ _ Standard deviation = 5) For a couple with three children, nd the variance and standard deviation of the number of 1 children who will be girls. Use [he following table to help you. p = 1 . 2 Outcomes B'B'B B'iG BiG'B B'GiG 67373 67376 (37673 (37646 Number of girls # = X Cl 1 1 2 1 2 2 3 1 1 1 1 1 1 1 1 Pmbabill : P _ _ _ W (X) 8 8 8 8 B 8 8 8 Standard deviation 2 v El i D 6) 1,000 rafe tickets were sold. There will be one rst prize of $1,000 and one second prize of $500. The rest of the tickets will win nodiing. Use the following table to calculate die variance and standard deviation. {1. = $1.50. Outcome : X $1,000 $500 $0 Probability = P(X} SW = 0.001 mlTo = 0.001 % = 0.993 Standard deviation = V 600 raFHe tickets were sold. There will he one first prize of $500 and three second prizes of $200. The rest of the tickets will win nothing. Use the chart to calculate the variance and standard deviation. in = $1.83. Outcome = X $500 $200 $0 _ _ 1 3 596 Probability : P A. _ _ _ ( f) 600 600 500 Variance = V Standard deviation = V
Step by Step Solution
There are 3 Steps involved in it

Get step-by-step solutions from verified subject matter experts