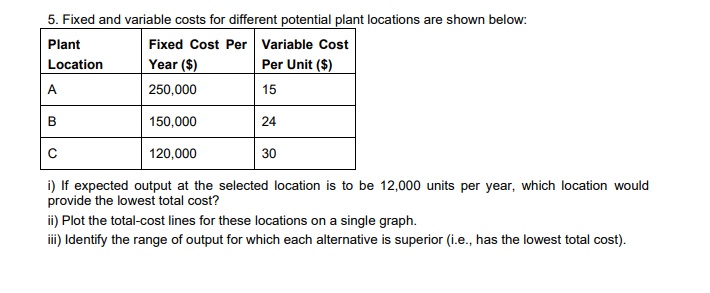
Question: 5. Fixed and variable costs for different potential plant locations are shown below: Plant Fixed Cost Per Variable Cost Location Year ($) Per Unit ($)

5. Fixed and variable costs for different

5. Fixed and variable costs for different potential plant locations are shown below: Plant Fixed Cost Per Variable Cost Location Year ($) Per Unit ($) A 250,000 15 B 150,000 24 120,000 30 i) If expected output at the selected location is to be 12,000 units per year, which location would provide the lowest total cost? ii) Plot the total-cost lines for these locations on a single graph. ii) Identify the range of output for which each alternative is superior (i.e., has the lowest total cost)

Step by Step Solution

There are 3 Steps involved in it

1 Expert Approved Answer
Step: 1 Unlock blur-text-image
Question Has Been Solved by an Expert!

Get step-by-step solutions from verified subject matter experts

Step: 2 Unlock
Step: 3 Unlock

Students Have Also Explored These Related General Management Questions!