

Question: 5. Given the following data for a make-or-buy decision: Make alternative Fixed Cost $70,000 Variable cost per unit $5.00 Revenue per unit $25.00 Buy alternative
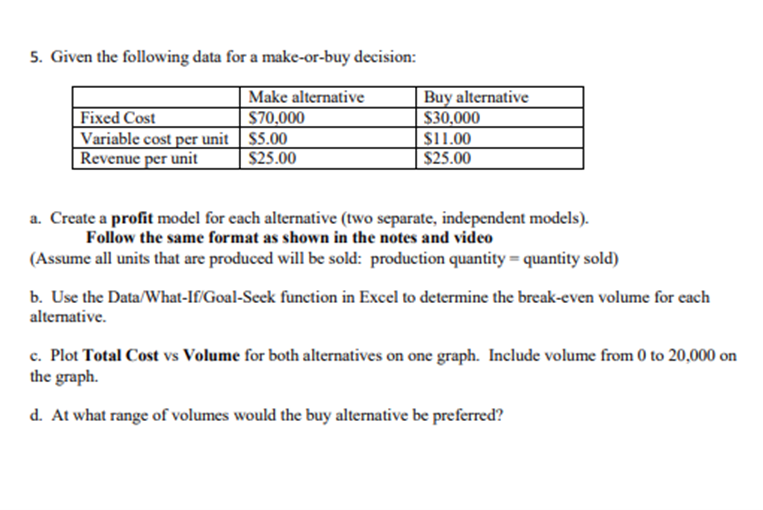
5. Given the following data for a make-or-buy decision: Make alternative Fixed Cost $70,000 Variable cost per unit $5.00 Revenue per unit $25.00 Buy alternative $30,000 $11.00 $25.00 a. Create a profit model for each alternative (two separate, independent models). Follow the same format as shown in the notes and video (Assume all units that are produced will be sold: production quantity = quantity sold) b. Use the Data/ What-lf/Goal-Seek function in Excel to determine the break-even volume for each alterative. c. Plot Total Cost vs Volume for both alternatives on one graph. Include volume from 0 to 20,000 on the graph. d. At what range of volumes would the buy alternative be preferred? 5. Given the following data for a make-or-buy decision: Make alternative Fixed Cost $70,000 Variable cost per unit $5.00 Revenue per unit $25.00 Buy alternative $30,000 $11.00 $25.00 a. Create a profit model for each alternative (two separate, independent models). Follow the same format as shown in the notes and video (Assume all units that are produced will be sold: production quantity = quantity sold) b. Use the Data/ What-lf/Goal-Seek function in Excel to determine the break-even volume for each alterative. c. Plot Total Cost vs Volume for both alternatives on one graph. Include volume from 0 to 20,000 on the graph. d. At what range of volumes would the buy alternative be preferred
Step by Step Solution
There are 3 Steps involved in it

Get step-by-step solutions from verified subject matter experts