

Question: . 5. Given the following FIT and TEST data seta: FIT data set: Program Modules Actual no. of Fault-Prone (FP Fault-prone Faults Y Not (NFF)
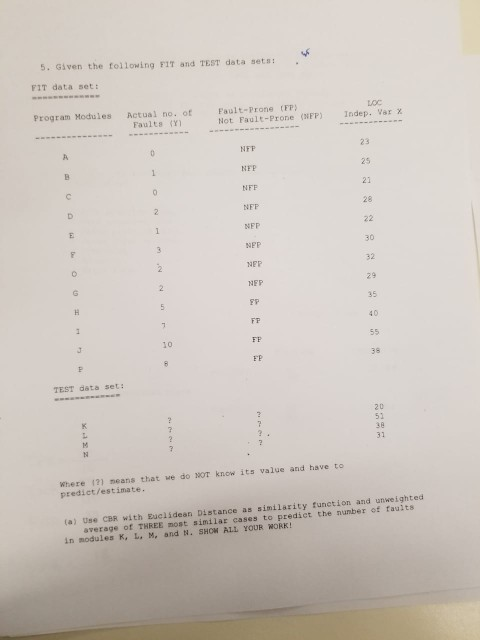
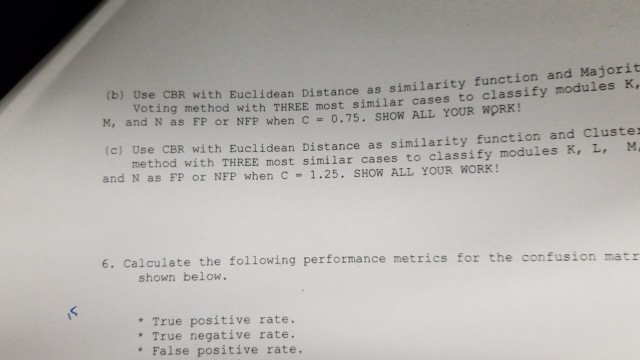
. 5. Given the following FIT and TEST data seta: FIT data set: Program Modules Actual no. of Fault-Prone (FP Fault-prone Faults Y Not (NFF) indep. var x NFP NEP NFF NFP NEP NEP NEP NEP FP FP 23 25 28 30 32 29 35 40 10 TEST data set: 51 38 31 14 where l ?)means that we do not know its value and have to predict/estimate. a) Use CBR with Euclidean Distance as similarity function and unweighted average of THREE most similaz cases to predict the nunber of faults in modules K, L. M, and N. SHOW ALL YOUR NORK! b) Use CBR with M, and N as FP or NFP when C uclidean Distance as similarity function and Majorit oting method with THREE most similar cases to classify modules K, 0.75. SHOW ALL YOUR WORK! (c) use CBR with Euclidean Distance as similarity function and Cluste method with THREE most similar cases to classify modules K, L, M and N as FP or NFP when C 1.25. SHOw ALL YOUR WORK! 6. Calculate the following performance metrics for the confusion matr shown below. * True positive rate. * True negative rate. * False positive rate. . 5. Given the following FIT and TEST data seta: FIT data set: Program Modules Actual no. of Fault-Prone (FP Fault-prone Faults Y Not (NFF) indep. var x NFP NEP NFF NFP NEP NEP NEP NEP FP FP 23 25 28 30 32 29 35 40 10 TEST data set: 51 38 31 14 where l ?)means that we do not know its value and have to predict/estimate. a) Use CBR with Euclidean Distance as similarity function and unweighted average of THREE most similaz cases to predict the nunber of faults in modules K, L. M, and N. SHOW ALL YOUR NORK! b) Use CBR with M, and N as FP or NFP when C uclidean Distance as similarity function and Majorit oting method with THREE most similar cases to classify modules K, 0.75. SHOW ALL YOUR WORK! (c) use CBR with Euclidean Distance as similarity function and Cluste method with THREE most similar cases to classify modules K, L, M and N as FP or NFP when C 1.25. SHOw ALL YOUR WORK! 6. Calculate the following performance metrics for the confusion matr shown below. * True positive rate. * True negative rate. * False positive rate
Step by Step Solution
There are 3 Steps involved in it

Get step-by-step solutions from verified subject matter experts