

Question: 5) Given the following gasoline data: Quarter 1 2 3 4 Year 1 150 140 185 160 Year 2 156 148 201 174 (a) Compute
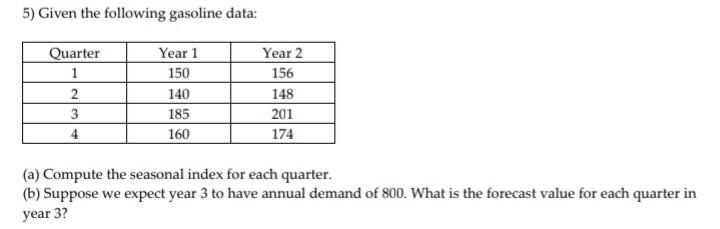
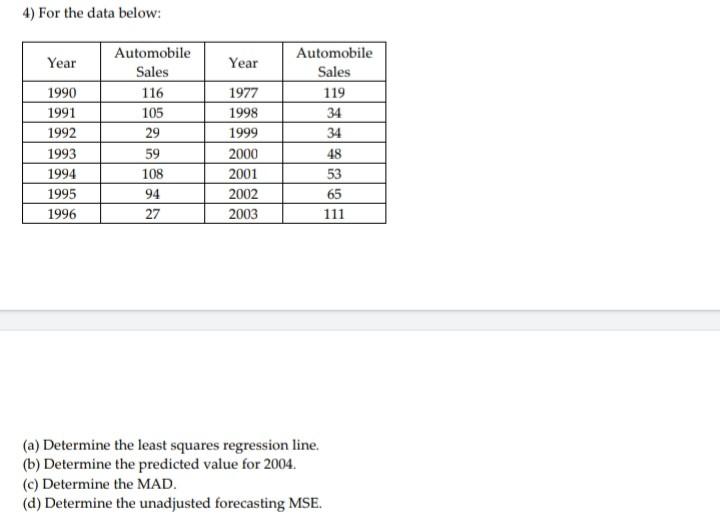
5) Given the following gasoline data: Quarter 1 2 3 4 Year 1 150 140 185 160 Year 2 156 148 201 174 (a) Compute the seasonal index for each quarter. (b) Suppose we expect year 3 to have annual demand of 800. What is the forecast value for each quarter in year 3? 4) For the data below: Year Year 1990 1991 1992 1993 1994 1995 1996 Automobile Sales 116 105 29 59 108 94 27 1977 1998 1999 2000 2001 2002 2003 Automobile Sales 119 34 34 48 53 65 111 (a) Determine the least squares regression line. (b) Determine the predicted value for 2004. (c) Determine the MAD. (d) Determine the unadjusted forecasting MSE
Step by Step Solution
There are 3 Steps involved in it
1 Expert Approved Answer
Step: 1 Unlock

Question Has Been Solved by an Expert!
Get step-by-step solutions from verified subject matter experts
Step: 2 Unlock
Step: 3 Unlock