

Question: 5. How much additional sales can the company support without having to add fixed assets? 6. Consider three possible scenarios for the next year: Sales
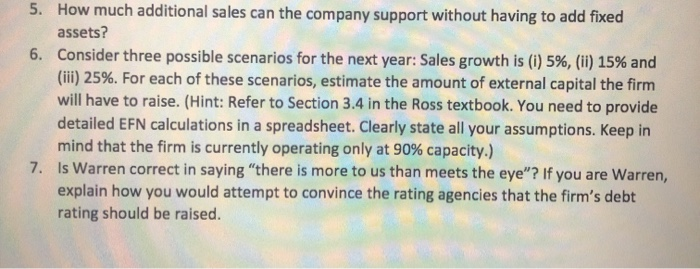
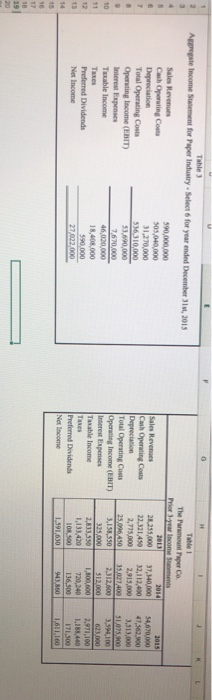
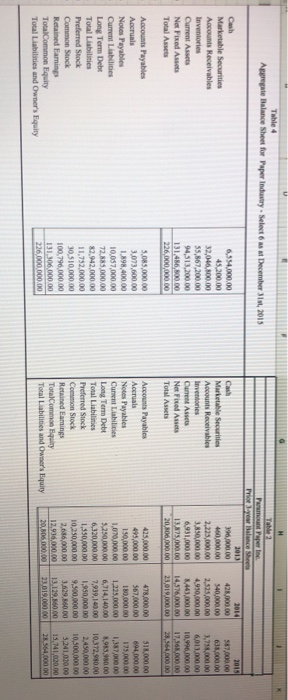
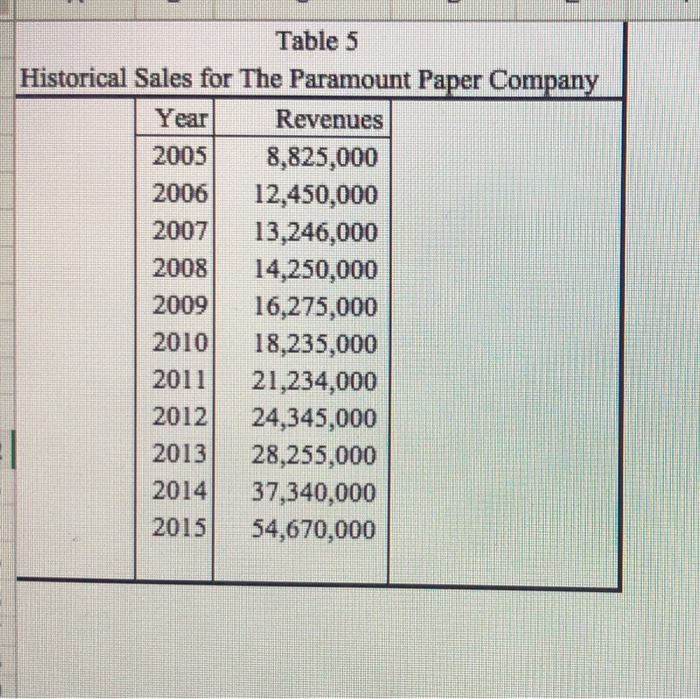
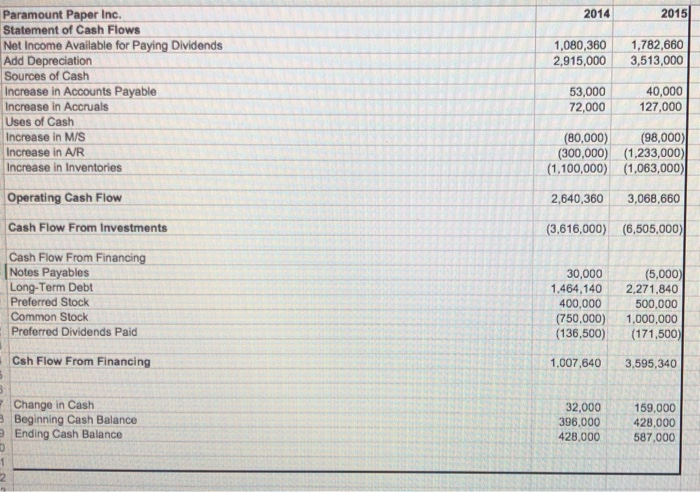
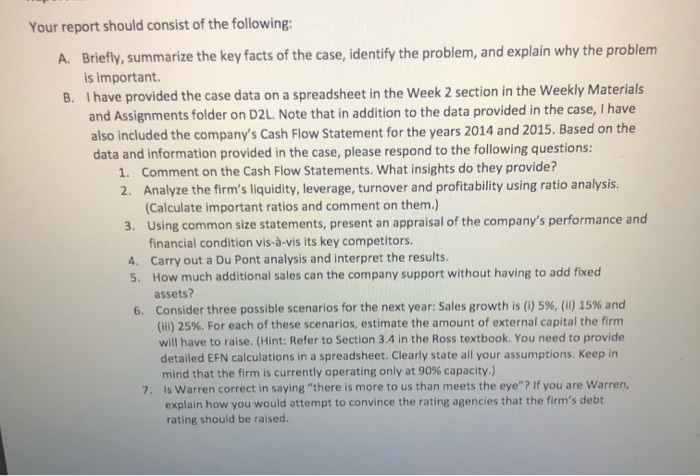
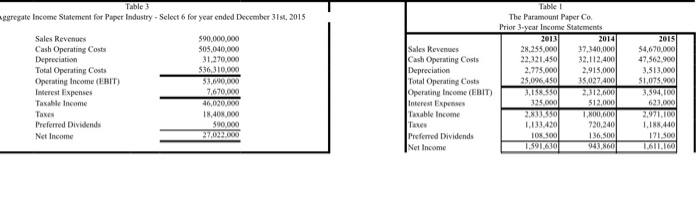
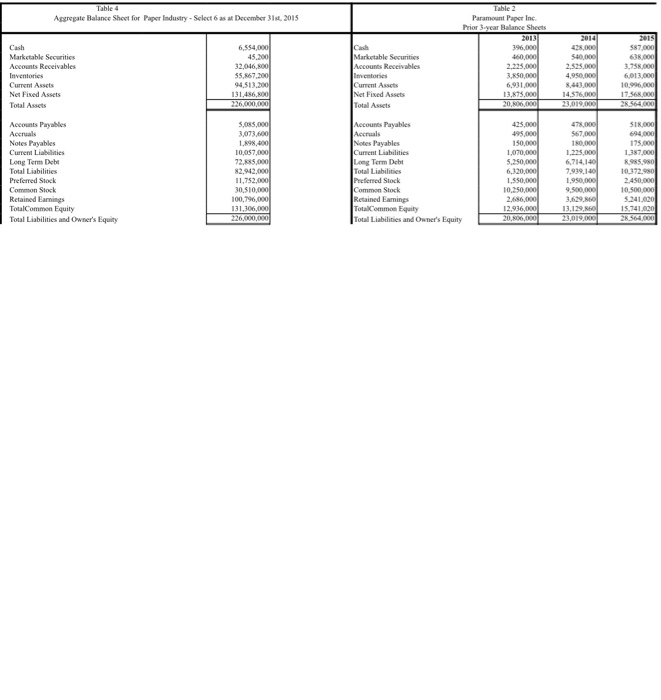
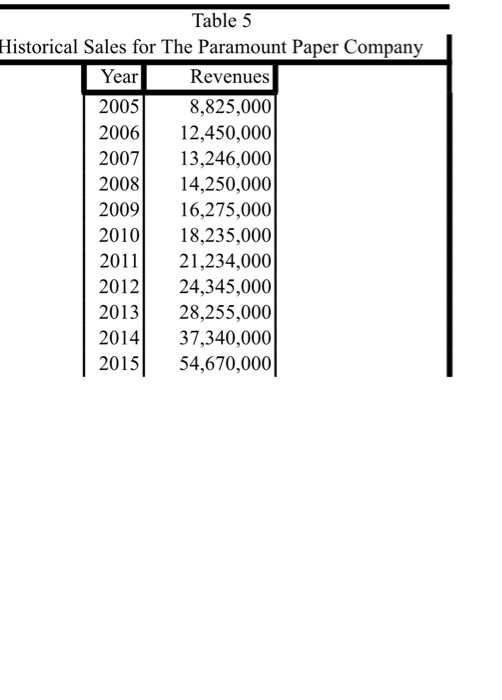
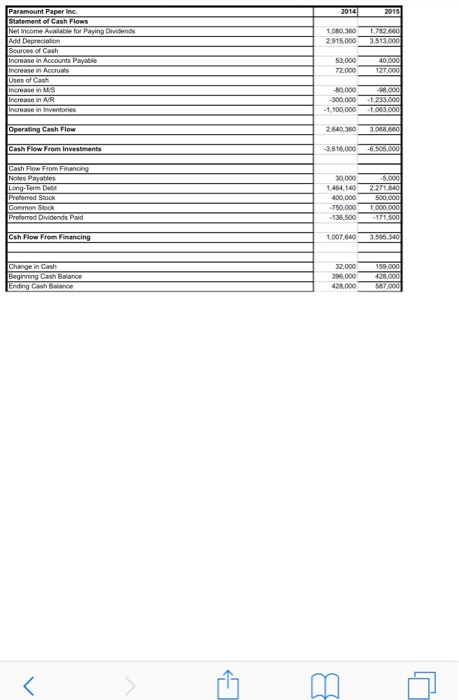
5. How much additional sales can the company support without having to add fixed assets? 6. Consider three possible scenarios for the next year: Sales growth is (i) 5%, (ii) 15% and (iii) 25%. For each of these scenarios, estimate the amount of external capital the firm will have to raise. (Hint: Refer to Section 3.4 in the Ross textbook. You need to provide detailed EFN calculations in a spreadsheet. Clearly state all your assumptions. Keep in mind that the firm is currently operating only at 90% capacity.) Is Warren correct in saying "there is more to us than meets the eye"? If you are Warren, explain how you would attempt to convince the rating agencies that the firm's debt rating should be raised. A p Table le Income Statement for Paper Industry. Select 6 for your ended December 2015 Table 1 The Parent Paper Co. Sales Revenues Cash Operating costs Depreciation Total Operating Costs Operating Income (EBIT) Interest Expenses Taxable income 390,000,000 505.040,000 31,270,000 56310.000 53,690,000 37,140,000 32,112,400 2,915.000 54,670,000 47,362,200 Sales Reves Cash Operating costs Depreciation Total Operating costs Operating Income (EBIT) Interest Expenses Taxable income 28.255.000 22,321.450 2,775.000 25,096,450 3,155,550 46,020,000 18,408,000 390.000 Preferred Dividends Net Income 2,833,330 1,133,420 1,185,40 Preferred Dwvidends Netlacome TORS 1.591.030 1.611160 Table Agregate Balance Sheet for Paper Industry. Select as December 2015 340,000.00 357,000.00 638,000.00 2,735,000.00 Marketable Securities Accounts Receivables Inventories Current Assets Net Fixed Assets Total Assets 6.954,000.00 45,200.00 32,04.100.00 55,867,200.00 94,513,200.00 131.416,800.00 226,000,000.00 Cash Marketable Securities Accounts Receivables Inventaries Current AS Not Fixed Assets Total Assets 390,000.00 460,000.00 2,225,000.00 3830,000.00 6,931,000.00 19.375000.00 20 806,000.00 4,950,000.00 8.443,000 10, 976,000.00 17.568.00000 28.564,000.00 25.019.000,00 Accounts Payables 478,000.00 367,000.00 518,000.00 694,000.00 Accounts Payables Accruals Notes Payables Current Liabilities Long Term Debt Total Liabilities Preferred Stock Common Stock Retained Haming Total Common Equity Total Liabilities and Owner's Equity 1,387,000.00 2,955,980.00 5,085,000.00 3073.600.00 1.898,400,00 10.057,000.00 72.885,000.00 82.92.000.00 11.732.000.00 30,510,000.00 100.796,000.00 131 306.000.00 425,000.00 495,000.00 150,000.00 1.070,000.00 3,250,000.00 6,320,000.00 1,350,000.00 10,250,000.00 Notes Payables Current Liabilities Long Term Debt Total Liabiles Preferred Stock Common Stock Read Lamings TotalCommon Total Liabilities and Owner's Equity 1225,000.00 6,714.140.00 7.939,140.00 1,950,000.00 9,500,000.00 3.629.650.00 13.129.860.00 23.019,000.00 10,500000.00 3,241,000.00 15.741,000.00 564,000.00 200 000,00 2015 1,080,360 2,915,000 1,782,660 3,513,000 Paramount Paper Inc. Statement of Cash Flows Net Income Available for Paying Dividends Add Depreciation Sources of Cash Increase in Accounts Payable Increase in Accruals Uses of Cash Increase in M/S Increase in A/R Increase in Inventories 53,000 72,000 40,000 127,000 (80,000) (300,000) (1,100,000) (98,000) (1.233,000) (1,063,000) Operating Cash Flow 2,640,360 3,068,660 Cash Flow From Investments (3,616,000) (6,505,000) Cash Flow From Financing Notes Payables Long-Term Debt Preferred Stock Common Stock Preferred Dividends Paid 30,000 1,464,140 400,000 (750,000) (136,500) (5,000) 2,271,840 500.000 1,000,000 (171,500 Csh Flow From Financing 1.007,640 3,595,340 Change in Cash Beginning Cash Balance Ending Cash Balance 32,000 396,000 428,000 159,000 428,000 587,000 Your report should consist of the following: A. Briefly, summarize the key facts of the case, identify the problem, and explain why the problem is important. B. I have provided the case data on a spreadsheet in the Week 2 section in the Weekly Materials and Assignments folder on D2L. Note that in addition to the data provided in the case, I have also included the company's Cash Flow Statement for the years 2014 and 2015. Based on the data and information provided in the case, please respond to the following questions: 1. Comment on the Cash Flow Statements. What insights do they provide? 2. Analyze the firm's liquidity, leverage, turnover and profitability using ratio analysis. (Calculate important ratios and comment on them.) 3. Using common size statements, present an appraisal of the company's performance and financial condition vis--vis its key competitors. 4. Carry out a Du Pont analysis and interpret the results. 5. How much additional sales can the company support without having to add fixed assets? 6. Consider three possible scenarios for the next year: Sales growth is (0) 5%, (1) 15% and (1) 25%. For each of these scenarios, estimate the amount of external capital the firm will have to raise. (Hint: Refer to Section 3.4 in the Ross textbook. You need to provide detailed EFN calculations in a spreadsheet. Clearly state all your assumptions. Keep in mind that the firm is currently operating only at 90% capacity.) 7. Is Warren correct in saying "there is more to us than meets the eye"? If you are Warren, explain how you would attempt to convince the rating agencies that the firm's debt rating should be raised. Table 3 aggregate Income Statement for Paper Industry. Select 6 for year ended December 31, 2015 Sales Revenues Cash Operating Costs Depreciation Total Operating Costs Operating Income (EBIT) Interest Expenses Tarane Income Taxes Preferred Dividends Net Income 2015 54,670,000 47.562.900 3,513,000 51,075,900 590,000,000 505,040.000 31.270.000 536.310.00 33.000000 7.620.000 46,020.000 18,408.000 590.000 27,022000 Table 1 The Paramount Paper Co. Prior 3-year Income Statements 20131 2014 28.255.000 37,340,000 22.321.4501 32.112,400 2,275.00 2.915.000 25. 450 35,027.400 3.138350 2012,600 325 col $12.000 2, 8 35C 1,100,000 1.133.4201 720,240 To sol 136.500 1,591.630 940 Sales Revenge Cash Operating costs Depreciation Total Operating Costs Operating Income (EBIT) Interest Expenses Taxable income Tanes Preferred Dividends Net Income 623.000 2,971,100 1.188.440 121 500 1.611.1601 Aggregate Balance Sheet for Paper Industry - Select 6 as at December 31, 2015 Paramount Paper Inc Prior year Balanse Sheets Cash Marketable Securities Accounts Receivables 540,000 6,554,000 45.200 32,046,800 S5,867,200 94 $13.300 Marketable Securities Accounts Receivables 396,000 460,000 2.225.000 3,650,000 6,931 000 57.000 63.000 3.758.000 6,013,000 10.990.000 4.950.00 Current Assets Net Fixed Assets Total Assists Current Aucts Net Fixed Assets Total Assets Accounts Payables Accounts Payables 478,000 56700 10.00 1.225.000 5,055,000 3,073,600 L 400 10,057,000 72.135.000 82,042,000 11,752,000 30,510,000 100,76.000 131,306,000 6.000.000 Notes Payables Current Liabilities Long Term Debt Total Liabilities Preferred Stock Common Stock Retained Earnings TotalCommon Equity Total Liabilities and Owner's Equity 7,939,140 425,000 495.000 150.000 1,070,000 5.250.000 6,190,000 1,550,000 10,250,000 2.686.000 Notes Payables Current Liabilities Long Term Debt Total Liabilities Preferred Stock Common Stock Retained Earings TotalCommon Equity Total Liabilities and Owner's Equity SIN.000 694,000 175.000 1,387,000 R95,980 10.192.980 2.450,000 10.500 000 5.341.00 15,741.620 25640 OS 20.106.000 2019, Table 5 Historical Sales for The Paramount Paper Company | Year Revenues 2005 8,825,000 2006 12,450,000 2007 13,246,000 2008 14,250,000 2009 16,275,000 2010) 18,235,000 2011 21,234,000 2012 24,345,000 2013 28,255,000 2014 37,340,000 | 2015 54,670,000 NORD 2.915.000 3.513,000 7200 71 000 30 000 1 100 000 200 30.00 1454,100 227 1600 GO 750.000 500 1 007 540 35963240 Beginning Cash Balance 30.000 428000 5. How much additional sales can the company support without having to add fixed assets? 6. Consider three possible scenarios for the next year: Sales growth is (i) 5%, (ii) 15% and (iii) 25%. For each of these scenarios, estimate the amount of external capital the firm will have to raise. (Hint: Refer to Section 3.4 in the Ross textbook. You need to provide detailed EFN calculations in a spreadsheet. Clearly state all your assumptions. Keep in mind that the firm is currently operating only at 90% capacity.) Is Warren correct in saying "there is more to us than meets the eye"? If you are Warren, explain how you would attempt to convince the rating agencies that the firm's debt rating should be raised. A p Table le Income Statement for Paper Industry. Select 6 for your ended December 2015 Table 1 The Parent Paper Co. Sales Revenues Cash Operating costs Depreciation Total Operating Costs Operating Income (EBIT) Interest Expenses Taxable income 390,000,000 505.040,000 31,270,000 56310.000 53,690,000 37,140,000 32,112,400 2,915.000 54,670,000 47,362,200 Sales Reves Cash Operating costs Depreciation Total Operating costs Operating Income (EBIT) Interest Expenses Taxable income 28.255.000 22,321.450 2,775.000 25,096,450 3,155,550 46,020,000 18,408,000 390.000 Preferred Dividends Net Income 2,833,330 1,133,420 1,185,40 Preferred Dwvidends Netlacome TORS 1.591.030 1.611160 Table Agregate Balance Sheet for Paper Industry. Select as December 2015 340,000.00 357,000.00 638,000.00 2,735,000.00 Marketable Securities Accounts Receivables Inventories Current Assets Net Fixed Assets Total Assets 6.954,000.00 45,200.00 32,04.100.00 55,867,200.00 94,513,200.00 131.416,800.00 226,000,000.00 Cash Marketable Securities Accounts Receivables Inventaries Current AS Not Fixed Assets Total Assets 390,000.00 460,000.00 2,225,000.00 3830,000.00 6,931,000.00 19.375000.00 20 806,000.00 4,950,000.00 8.443,000 10, 976,000.00 17.568.00000 28.564,000.00 25.019.000,00 Accounts Payables 478,000.00 367,000.00 518,000.00 694,000.00 Accounts Payables Accruals Notes Payables Current Liabilities Long Term Debt Total Liabilities Preferred Stock Common Stock Retained Haming Total Common Equity Total Liabilities and Owner's Equity 1,387,000.00 2,955,980.00 5,085,000.00 3073.600.00 1.898,400,00 10.057,000.00 72.885,000.00 82.92.000.00 11.732.000.00 30,510,000.00 100.796,000.00 131 306.000.00 425,000.00 495,000.00 150,000.00 1.070,000.00 3,250,000.00 6,320,000.00 1,350,000.00 10,250,000.00 Notes Payables Current Liabilities Long Term Debt Total Liabiles Preferred Stock Common Stock Read Lamings TotalCommon Total Liabilities and Owner's Equity 1225,000.00 6,714.140.00 7.939,140.00 1,950,000.00 9,500,000.00 3.629.650.00 13.129.860.00 23.019,000.00 10,500000.00 3,241,000.00 15.741,000.00 564,000.00 200 000,00 2015 1,080,360 2,915,000 1,782,660 3,513,000 Paramount Paper Inc. Statement of Cash Flows Net Income Available for Paying Dividends Add Depreciation Sources of Cash Increase in Accounts Payable Increase in Accruals Uses of Cash Increase in M/S Increase in A/R Increase in Inventories 53,000 72,000 40,000 127,000 (80,000) (300,000) (1,100,000) (98,000) (1.233,000) (1,063,000) Operating Cash Flow 2,640,360 3,068,660 Cash Flow From Investments (3,616,000) (6,505,000) Cash Flow From Financing Notes Payables Long-Term Debt Preferred Stock Common Stock Preferred Dividends Paid 30,000 1,464,140 400,000 (750,000) (136,500) (5,000) 2,271,840 500.000 1,000,000 (171,500 Csh Flow From Financing 1.007,640 3,595,340 Change in Cash Beginning Cash Balance Ending Cash Balance 32,000 396,000 428,000 159,000 428,000 587,000 Your report should consist of the following: A. Briefly, summarize the key facts of the case, identify the problem, and explain why the problem is important. B. I have provided the case data on a spreadsheet in the Week 2 section in the Weekly Materials and Assignments folder on D2L. Note that in addition to the data provided in the case, I have also included the company's Cash Flow Statement for the years 2014 and 2015. Based on the data and information provided in the case, please respond to the following questions: 1. Comment on the Cash Flow Statements. What insights do they provide? 2. Analyze the firm's liquidity, leverage, turnover and profitability using ratio analysis. (Calculate important ratios and comment on them.) 3. Using common size statements, present an appraisal of the company's performance and financial condition vis--vis its key competitors. 4. Carry out a Du Pont analysis and interpret the results. 5. How much additional sales can the company support without having to add fixed assets? 6. Consider three possible scenarios for the next year: Sales growth is (0) 5%, (1) 15% and (1) 25%. For each of these scenarios, estimate the amount of external capital the firm will have to raise. (Hint: Refer to Section 3.4 in the Ross textbook. You need to provide detailed EFN calculations in a spreadsheet. Clearly state all your assumptions. Keep in mind that the firm is currently operating only at 90% capacity.) 7. Is Warren correct in saying "there is more to us than meets the eye"? If you are Warren, explain how you would attempt to convince the rating agencies that the firm's debt rating should be raised. Table 3 aggregate Income Statement for Paper Industry. Select 6 for year ended December 31, 2015 Sales Revenues Cash Operating Costs Depreciation Total Operating Costs Operating Income (EBIT) Interest Expenses Tarane Income Taxes Preferred Dividends Net Income 2015 54,670,000 47.562.900 3,513,000 51,075,900 590,000,000 505,040.000 31.270.000 536.310.00 33.000000 7.620.000 46,020.000 18,408.000 590.000 27,022000 Table 1 The Paramount Paper Co. Prior 3-year Income Statements 20131 2014 28.255.000 37,340,000 22.321.4501 32.112,400 2,275.00 2.915.000 25. 450 35,027.400 3.138350 2012,600 325 col $12.000 2, 8 35C 1,100,000 1.133.4201 720,240 To sol 136.500 1,591.630 940 Sales Revenge Cash Operating costs Depreciation Total Operating Costs Operating Income (EBIT) Interest Expenses Taxable income Tanes Preferred Dividends Net Income 623.000 2,971,100 1.188.440 121 500 1.611.1601 Aggregate Balance Sheet for Paper Industry - Select 6 as at December 31, 2015 Paramount Paper Inc Prior year Balanse Sheets Cash Marketable Securities Accounts Receivables 540,000 6,554,000 45.200 32,046,800 S5,867,200 94 $13.300 Marketable Securities Accounts Receivables 396,000 460,000 2.225.000 3,650,000 6,931 000 57.000 63.000 3.758.000 6,013,000 10.990.000 4.950.00 Current Assets Net Fixed Assets Total Assists Current Aucts Net Fixed Assets Total Assets Accounts Payables Accounts Payables 478,000 56700 10.00 1.225.000 5,055,000 3,073,600 L 400 10,057,000 72.135.000 82,042,000 11,752,000 30,510,000 100,76.000 131,306,000 6.000.000 Notes Payables Current Liabilities Long Term Debt Total Liabilities Preferred Stock Common Stock Retained Earnings TotalCommon Equity Total Liabilities and Owner's Equity 7,939,140 425,000 495.000 150.000 1,070,000 5.250.000 6,190,000 1,550,000 10,250,000 2.686.000 Notes Payables Current Liabilities Long Term Debt Total Liabilities Preferred Stock Common Stock Retained Earings TotalCommon Equity Total Liabilities and Owner's Equity SIN.000 694,000 175.000 1,387,000 R95,980 10.192.980 2.450,000 10.500 000 5.341.00 15,741.620 25640 OS 20.106.000 2019, Table 5 Historical Sales for The Paramount Paper Company | Year Revenues 2005 8,825,000 2006 12,450,000 2007 13,246,000 2008 14,250,000 2009 16,275,000 2010) 18,235,000 2011 21,234,000 2012 24,345,000 2013 28,255,000 2014 37,340,000 | 2015 54,670,000 NORD 2.915.000 3.513,000 7200 71 000 30 000 1 100 000 200 30.00 1454,100 227 1600 GO 750.000 500 1 007 540 35963240 Beginning Cash Balance 30.000 428000
Step by Step Solution
There are 3 Steps involved in it

Get step-by-step solutions from verified subject matter experts