

Question: 5 In. GRAPH SETTINGS Reset Show y - y Show residuals y - y Choose a Dataset (1 to 100) 97 Intercept 15 (-6 to
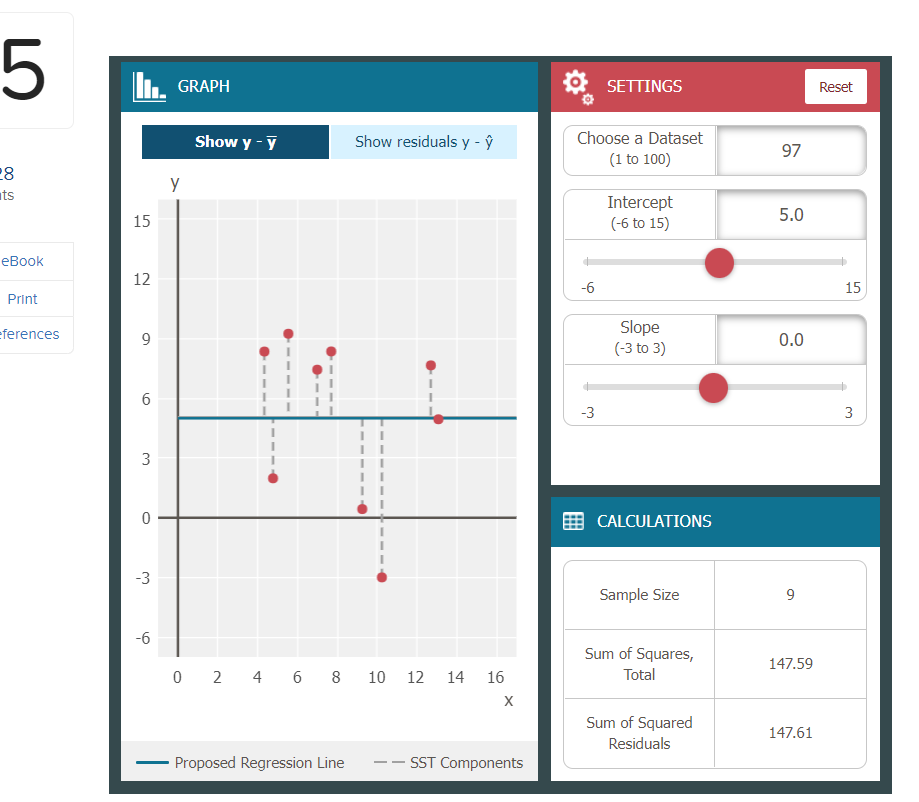
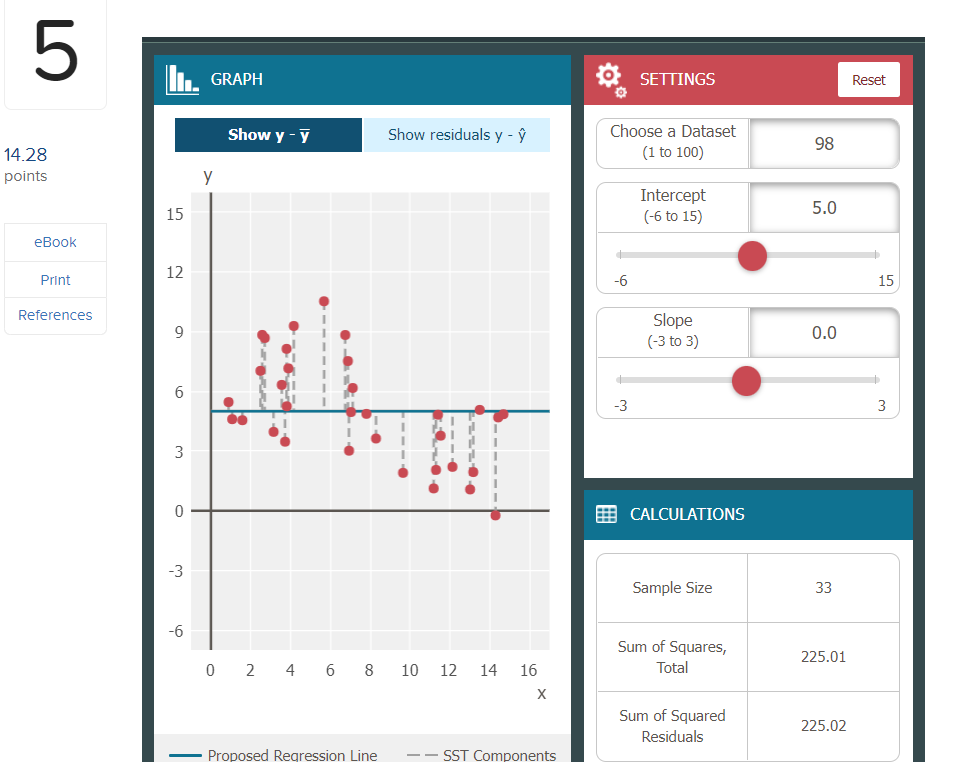


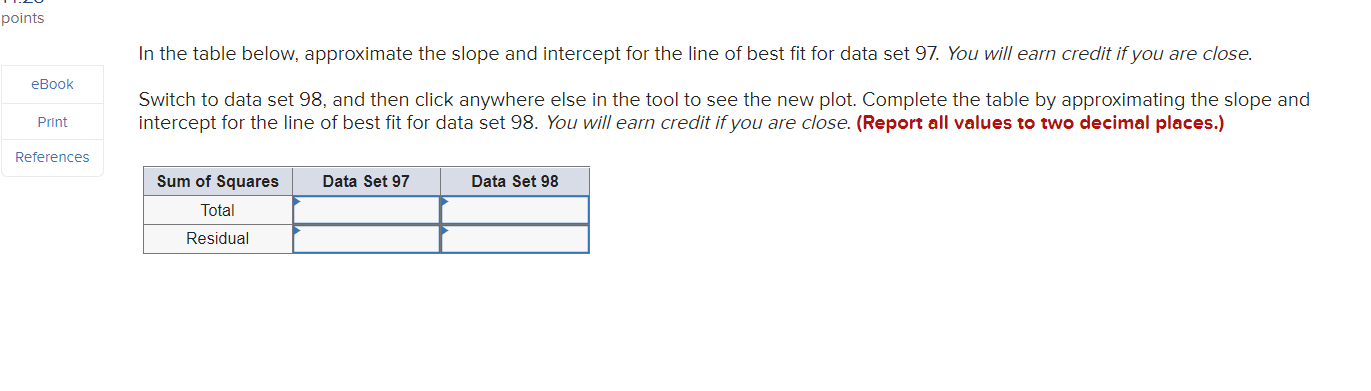
5 In. GRAPH SETTINGS Reset Show y - y Show residuals y - y Choose a Dataset (1 to 100) 97 Intercept 15 (-6 to 15) 5.0 eBook 12 -6 15 Print ferences Slope 9 (-3 to 3) 0.0 6 -3 3 3 0 CALCULATIONS -3 Sample Size LD -6 Sum of Squares, 147.59 0 2 4 6 8 10 12 14 16 Total X Sum of Squared 147.61 Residuals - Proposed Regression Line - - SST Components5 In- GRAPH SETTINGS Reset Show y - y Show residuals y - y Choose a Dataset 14.28 (1 to 100) 98 points Intercept 15 (-6 to 15) 5.0 eBook Print 12 -6 15 References 9 Slope (-3 to 3) 0.0 6 -3 3 3 0 CALCULATIONS -3 Sample Size 33 -6 Sum of Squares, 225.01 0 2 4 6 8 10 12 14 16 Total X Sum of Squared 225.02 Residuals Proposed Regression Li SSI Componentspoints In the table below, approximate the slope and intercept for the line of best t for data set 9?. You wit! earn credit ifyou are dose. eBook Switch to data set 98. and then click anywhere else in the tool to see the new plot. Complete the table by approximating the slope and Print intercept for the line of best t for data set 98. You will earn credit ifyou are dose. (Report all values to two decimal places.) References Sum of Squares Dal: Set 97' Data Set 98 Total Residual
Step by Step Solution
There are 3 Steps involved in it

Get step-by-step solutions from verified subject matter experts