

Question: 5. NPV profiles An NPV profile plots a project's NPV at various costs of capital, labeled A and B in the graph. A project's NPV
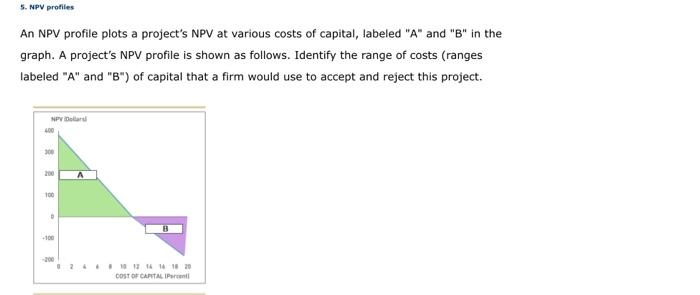

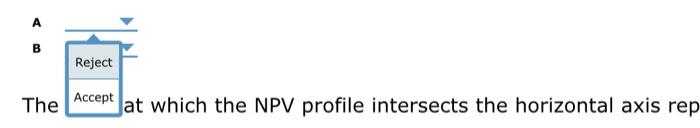
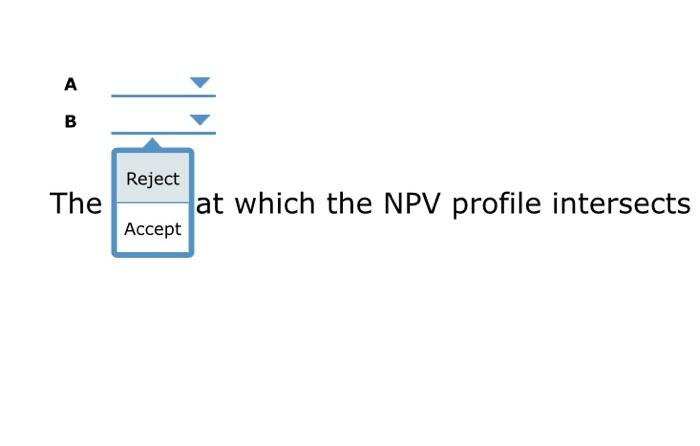
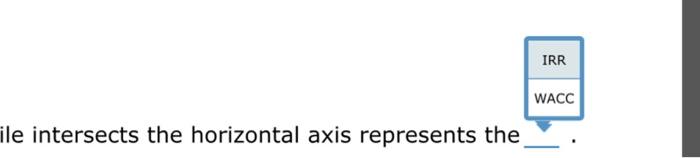
5. NPV profiles An NPV profile plots a project's NPV at various costs of capital, labeled "A" and "B" in the graph. A project's NPV profile is shown as follows. Identify the range of costs (ranges labeled "A" and "B") of capital that a firm would use to accept and reject this project. NPV Dollar 400 300 100 +100 -200 B 02448 10 12 14 16 18 20 COST OF CAPITAL (Percent The point at which the NPV profile intersects the horizontal axis represents the A B The Reject Accept Jat which the NPV profile intersects the horizontal axis rep A B The Reject Accept at which the NPV profile intersects ile intersects the horizontal axis represents the IRR WACC
Step by Step Solution
There are 3 Steps involved in it

Get step-by-step solutions from verified subject matter experts