

Question: Please circle answer 5. NPV profiles An NPV profile plots a project's NPV at various costs of capital, labeled A and B in the graph.
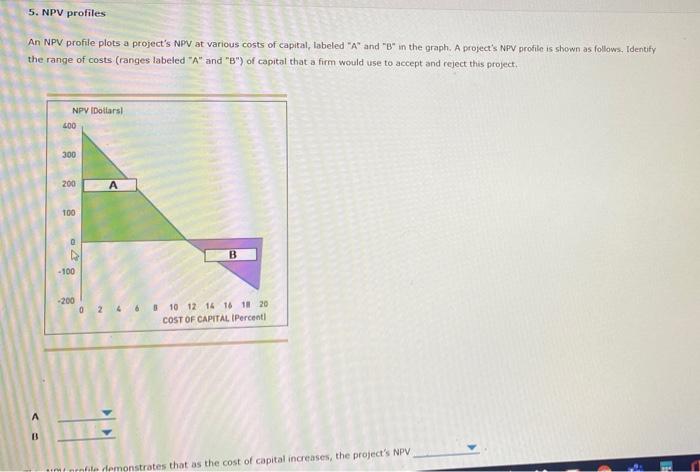

5. NPV profiles An NPV profile plots a project's NPV at various costs of capital, labeled "A" and "B" in the graph. A project's NPV profile is shown as follows. Identity the range of costs (ranges labeled "A" and "B") of capital that a firm would use to accept and reject this project, NPV IDollars 400 300 200 A 100 0 -100 -200 0 2 4 6 8 10 12 14 16 18 20 COST OF CAPITAL I Percent A immobile demonstrates that as the cost of capital increases, the project's NPV This NPV profile demonstrates that as the cost of capital increases, the project's NPV Grade IN 5. NPV profiles An NPV profile plots a project's NPV at various costs of capital, labeled "A" and "B" in the graph. A project's NPV profile is shown as follows. Identity the range of costs (ranges labeled "A" and "B") of capital that a firm would use to accept and reject this project, NPV IDollars 400 300 200 A 100 0 -100 -200 0 2 4 6 8 10 12 14 16 18 20 COST OF CAPITAL I Percent A immobile demonstrates that as the cost of capital increases, the project's NPV This NPV profile demonstrates that as the cost of capital increases, the project's NPV Grade IN
Step by Step Solution
There are 3 Steps involved in it

Get step-by-step solutions from verified subject matter experts