

Question: 5. NPV profiles An NPV profile plots a projects NPV at various costs of capital, labeled A and B in the graph. A projects NPV
 5. NPV profiles
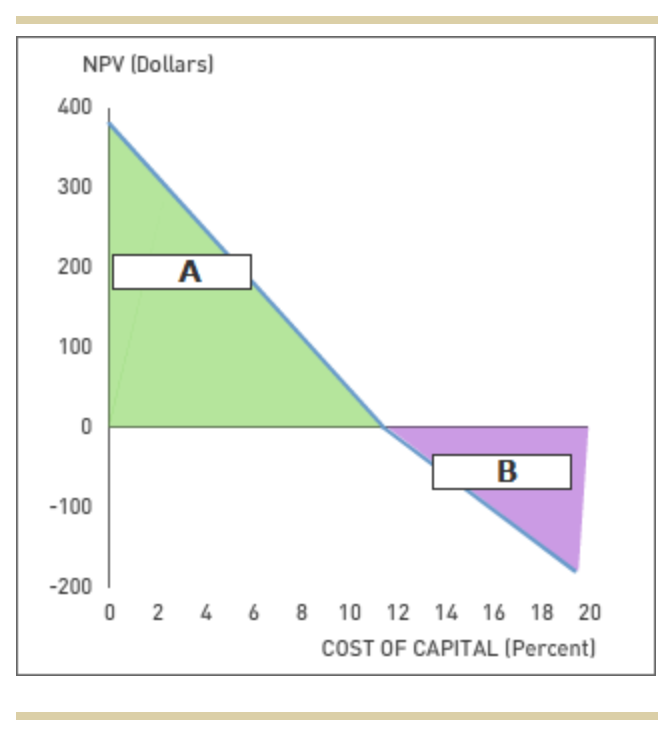
An NPV profile plots a projects NPV at various costs of capital, labeled "A" and "B" in the graph. A projects NPV profile is shown as follows. Identify the range of costs (ranges labeled "A" and "B") of capital that a firm would use to accept and reject this project.
| A | |
| B |
This NPV profile demonstrates that as the cost of capital increases, the projects NPV
NPV (Dollars) 400 300 200 A 100 0 B -100 -200 0 2 4 6 8 10 12 14 16 18 20 COST OF CAPITAL (Percent)
Step by Step Solution
There are 3 Steps involved in it
1 Expert Approved Answer
Step: 1 Unlock

Question Has Been Solved by an Expert!
Get step-by-step solutions from verified subject matter experts
Step: 2 Unlock
Step: 3 Unlock