

Question: 5. On a third worksheet named Simulate, simulate the cost of not inspecting the bindings for a sample of 100 skis. Use the headings shown
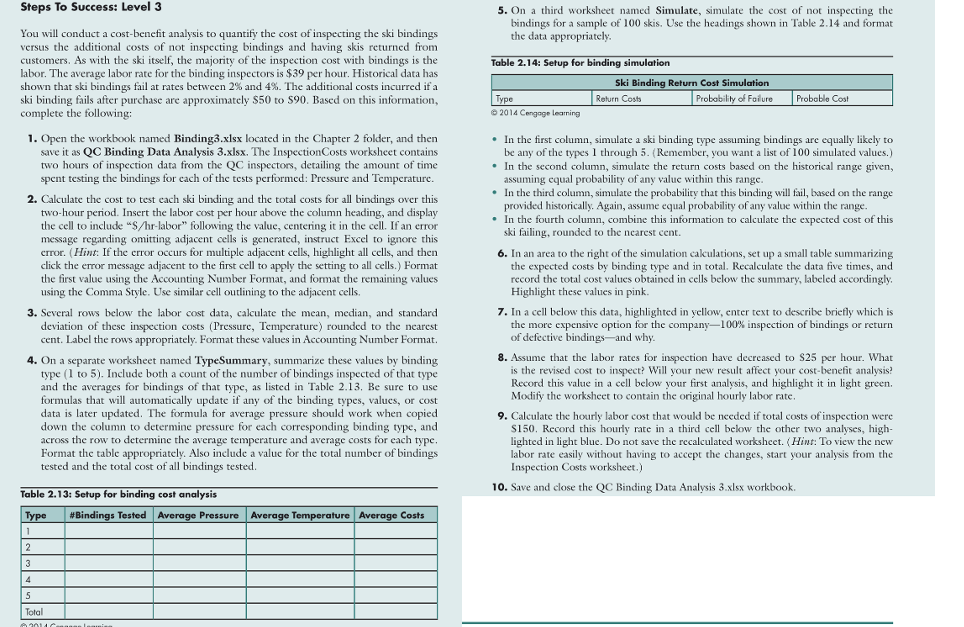
5. On a third worksheet named Simulate, simulate the cost of not inspecting the bindings for a sample of 100 skis. Use the headings shown in Table 2.14 and format the data appropriately Table 2.14: Setup for binding simulation Ski Binding Return Cost Simulation Type Return Costa Probability of Failure 2014 Cangage learning Probable Cost Steps To Success: Level 3 You will conduct a cost-benefit analysis to quantify the cost of inspecting the ski bindings versus the additional costs of not inspecting bindings and having skis returned from customers. As with the ski itself, the majority of the inspection cost with bindings is the labor. The average labor rate for the binding inspectors is $39 per hour. Historical data has shown that ski bindings fail at rates between 2% and 4%. The additional costs incurred if a ski binding fails after purchase are approximately $50 to $90. Based on this information, complete the following: 1. Open the workbook named Binding3.xlsx located in the Chapter 2 folder, and then save it as QC Binding Data Analysis 3.xlsx. The Inspection Costs worksheet contains two hours of inspection data from the QC inspectors, detailing the amount of time spent testing the bindings for each of the tests performed: Pressure and Temperature. 2. Calculate the cost to test cach ski binding and the total costs for all bindings over this two-hour period. Insert the labor cost per hour above the column heading, and display the cell to include "s/hr-labor" following the value, centering it in the cell. If an error message regarding omitting adjacent cells is generated, instruct Excel to ignore this error. (Hint: If the error occurs for multiple adjacent cells, highlight all cells, and then click the error message adjacent to the first cell to apply the setting to all cells.) Format the first value using the Accounting Number Format, and format the remaining values using the Comma Style. Use similar cell outlining to the adjacent cells. 3. Several rows below the labor cost data, calculate the mean, median, and standard deviation of these inspection costs (Pressure, Temperature) rounded to the nearest cent. Label the rows appropriately. Format these values in Accounting Number Format. 4. On a separate worksheet named TypeSummary, summarize these values by binding type (1 to 5). Include both a count of the number of bindings inspected of that type and the averages for bindings of that type, as listed in Table 2.13. Be sure to use formulas that will automatically update if any of the binding types, values, or cost data is later updated. The formula for average pressure should work when copied down the column to determine pressure for each corresponding binding type, and across the row to determine the average temperature and average costs for each type, Format the table appropriately. Also include a value for the total number of bindings tested and the total cost of all bindings tested. In the first column, simulate a ski binding type assuming bindings are equally likely to be any of the types 1 through 5. Remember, you want a list of 100 simulated values.) In the second column, simulate the return costs based on the historical range given, assuming equal probability of any value within this range. In the third column, simulate the probability that this binding will fail, based on the range provided historically. Again, assume equal probability of any value within the range. In the fourth column, combine this information to calculate the expected cost of this ski failing, rounded to the ncarest cent. 6. In an area to the right of the simulation cakulations, set up a small table summarizing the expected costs by binding type and in total. Recalculate the data five times, and record the total cost values obtained in cells below the summary, labeled accordingly. Highlight these values in pink 7. In a cell below this data, highlighted in yellow, enter text to describe briefly which is the more expensive option for the company-100% inspection of bindings or return of defective bindings- and why. 8. Assume that the labor rates for inspection have decreased to S25 per hour. What is the revised cost to inspect? Will your new result affect your cost-benefit analysis? Record this value in a cell below your first analysis, and highlight it in light green Modify the worksheet to contain the original hourly labor rate, 9. Calculate the hourly labor cost that would be needed if total costs of inspection were $150. Record this hourly rate in a third cell below the other two analyses, high- lighted in light blue. Do not save the recalculated worksheet. (Hint: To view the new labor rate easily without having to accept the changes, start your analysis from the Inspection Costs worksheet.) 10. Save and close the QC Binding Data Analysis 3.xlsx workbook. Average Temperature Average Costs Table 2.13: Setup for binding cost analysis Type #Bindings Tested Average Pressure 1 2 3 4 5 Total 5. On a third worksheet named Simulate, simulate the cost of not inspecting the bindings for a sample of 100 skis. Use the headings shown in Table 2.14 and format the data appropriately Table 2.14: Setup for binding simulation Ski Binding Return Cost Simulation Type Return Costa Probability of Failure 2014 Cangage learning Probable Cost Steps To Success: Level 3 You will conduct a cost-benefit analysis to quantify the cost of inspecting the ski bindings versus the additional costs of not inspecting bindings and having skis returned from customers. As with the ski itself, the majority of the inspection cost with bindings is the labor. The average labor rate for the binding inspectors is $39 per hour. Historical data has shown that ski bindings fail at rates between 2% and 4%. The additional costs incurred if a ski binding fails after purchase are approximately $50 to $90. Based on this information, complete the following: 1. Open the workbook named Binding3.xlsx located in the Chapter 2 folder, and then save it as QC Binding Data Analysis 3.xlsx. The Inspection Costs worksheet contains two hours of inspection data from the QC inspectors, detailing the amount of time spent testing the bindings for each of the tests performed: Pressure and Temperature. 2. Calculate the cost to test cach ski binding and the total costs for all bindings over this two-hour period. Insert the labor cost per hour above the column heading, and display the cell to include "s/hr-labor" following the value, centering it in the cell. If an error message regarding omitting adjacent cells is generated, instruct Excel to ignore this error. (Hint: If the error occurs for multiple adjacent cells, highlight all cells, and then click the error message adjacent to the first cell to apply the setting to all cells.) Format the first value using the Accounting Number Format, and format the remaining values using the Comma Style. Use similar cell outlining to the adjacent cells. 3. Several rows below the labor cost data, calculate the mean, median, and standard deviation of these inspection costs (Pressure, Temperature) rounded to the nearest cent. Label the rows appropriately. Format these values in Accounting Number Format. 4. On a separate worksheet named TypeSummary, summarize these values by binding type (1 to 5). Include both a count of the number of bindings inspected of that type and the averages for bindings of that type, as listed in Table 2.13. Be sure to use formulas that will automatically update if any of the binding types, values, or cost data is later updated. The formula for average pressure should work when copied down the column to determine pressure for each corresponding binding type, and across the row to determine the average temperature and average costs for each type, Format the table appropriately. Also include a value for the total number of bindings tested and the total cost of all bindings tested. In the first column, simulate a ski binding type assuming bindings are equally likely to be any of the types 1 through 5. Remember, you want a list of 100 simulated values.) In the second column, simulate the return costs based on the historical range given, assuming equal probability of any value within this range. In the third column, simulate the probability that this binding will fail, based on the range provided historically. Again, assume equal probability of any value within the range. In the fourth column, combine this information to calculate the expected cost of this ski failing, rounded to the ncarest cent. 6. In an area to the right of the simulation cakulations, set up a small table summarizing the expected costs by binding type and in total. Recalculate the data five times, and record the total cost values obtained in cells below the summary, labeled accordingly. Highlight these values in pink 7. In a cell below this data, highlighted in yellow, enter text to describe briefly which is the more expensive option for the company-100% inspection of bindings or return of defective bindings- and why. 8. Assume that the labor rates for inspection have decreased to S25 per hour. What is the revised cost to inspect? Will your new result affect your cost-benefit analysis? Record this value in a cell below your first analysis, and highlight it in light green Modify the worksheet to contain the original hourly labor rate, 9. Calculate the hourly labor cost that would be needed if total costs of inspection were $150. Record this hourly rate in a third cell below the other two analyses, high- lighted in light blue. Do not save the recalculated worksheet. (Hint: To view the new labor rate easily without having to accept the changes, start your analysis from the Inspection Costs worksheet.) 10. Save and close the QC Binding Data Analysis 3.xlsx workbook. Average Temperature Average Costs Table 2.13: Setup for binding cost analysis Type #Bindings Tested Average Pressure 1 2 3 4 5 Total
Step by Step Solution
There are 3 Steps involved in it

Get step-by-step solutions from verified subject matter experts