

Question: 5 part question. Historical returns Calculate the arithmetic average return of US Treasury bills, long-term government bonds, and large company stocks for 1986 to 1995.
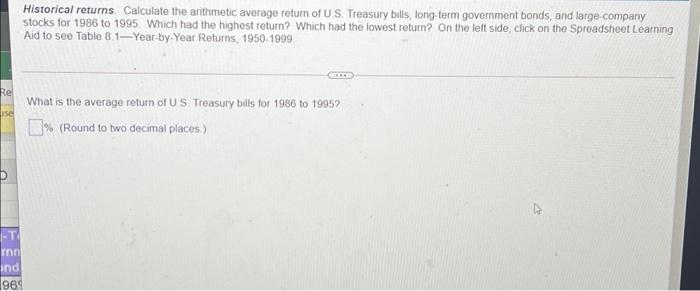
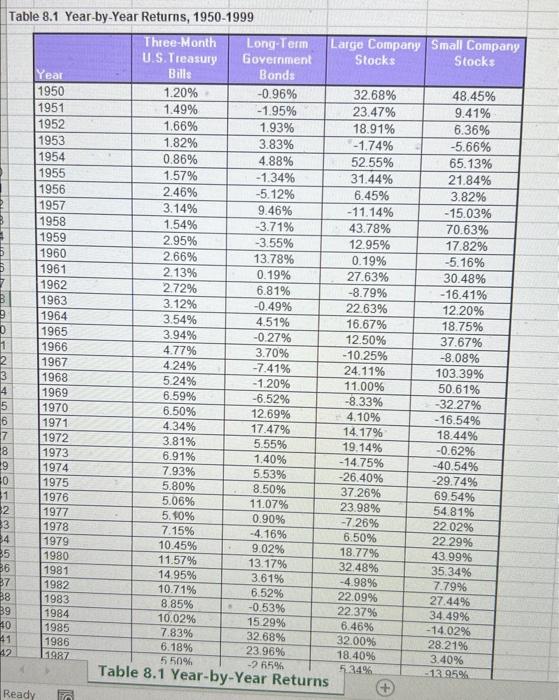
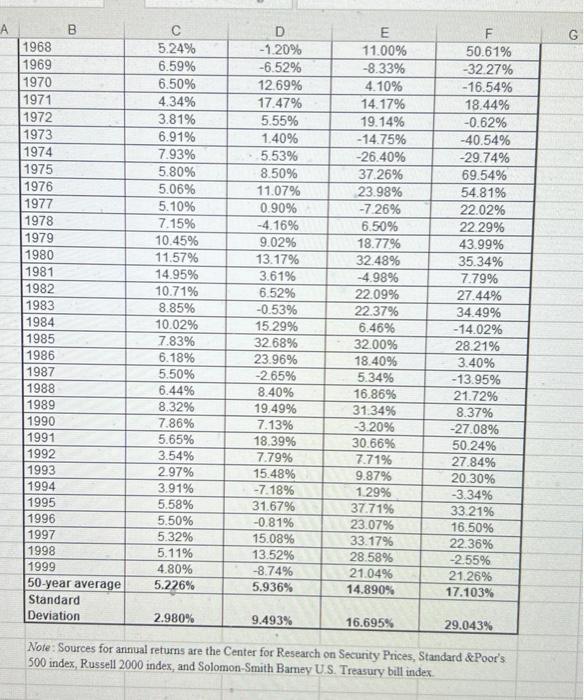
Historical returns Calculate the arithmetic average return of US Treasury bills, long-term government bonds, and large company stocks for 1986 to 1995. Which had the highest return? Which had the lowest return? On the left side, click on the Spreadsheet Learning Aid to see Table 8 1-Year-by-Year Returns, 1950 1999. Re use What is the average return of US Treasury bills for 1986 to 1995 % (Round to two decimal places) -T inn ind 960 Table 8.1 Year-by-Year Returns, 1950-1999 Three-Month Long-Term Large Company Small Company U.S. Treasury Government Stocks Stocks Year Bills Bonds 1950 1.20% -0.96% 32.68% 48,45% 1951 1.49% -1.95% 23.47% 9.41% 1952 1.66% 1.93% 18.91% 6.36% 1953 1.82% 3.83% -1.74% -5.66% 1954 0.86% 4.88% 52.55% 65.13% 1955 1.57% -1.34% 31.44% 21,84% 1956 2.46% -5.12% 6.45% 3.82% 1957 3.14% 9.46% -11.14% -15.03% 1958 1.54% -3.71% 43.78% 70.63% 1959 2.95% -3.55% 12.95% 17.82% 1960 2.66% 13.78% 0.19% -5.16% 1961 2.13% 0.19% 27.63% 30.48% 1962 2.72% 6.81% -8.79% -16.41% B 1963 3.12% -0.49% 22.63% 12.20% 9 1964 3.54% 4.51% 16.67% 18.75% D 1965 3.94% -0.27% 12.50% 37.67% 1966 4.77% 3.70% -10.25% -8.08% 2 1967 4.24% -7.41% 24.11% 103.39% 1968 5.24% -1.20% 11.00% 50.61% 4 1969 6.59% -6.52% -8.33% -32.27% 5 1970 6.50% 12.69% 4.10% - 16.54% 6 1971 4.34% 17.47% 14.17% 18.44% 7 1972 3.81% 5.55% 19.14% -0.62% 18 1973 6.91% 1.40% -14.75% -40.54% 1974 7.93% 5.53% -26.40% -29.74% 0 1975 5.80% 8.50% 37.26% 69.54% 1 1976 5.06% 11.07% 23.98% 54.81% 2 1977 5. 10% 0.90% -7.26% 22.02% 3 1978 7.15% -4.16% 6.50% 22 29% 4 1979 10.45% 9.02% 18.77% 25 43.99% 1980 11.57% 13.17% 32.48% 36 1981 35.34% 14.95% 3.61% -4.98% 37 7.79% 1982 10.71% 6.52% 38 22.09% 27.44% 1983 8.85% -0.53% 22.37% B9 1984 34.49% 10.02% 15 29% HO 1985 6.46% -14.02% 7.83% 32.68% 41 32.00% 1986 28.21% 6.18% 23.96% 12 1987 18.40% 3.40% 5 50% -2 65% Table 8.1 Year-by-Year Returns - 13.95% Ready 3 NONNON 5.34% G S 1968 1969 1970 1971 1972 1973 1974 1975 1976 1977 1978 1979 1980 1981 1982 1983 1984 1985 1986 1987 1988 1989 1990 1991 1992 1993 1994 1995 1996 1997 1998 1999 50-year average Standard Deviation 5.24% 6.59% 6.50% 4.34% 3.81% 6.91% 7.93% 5.80% 5.06% 5.10% 7.15% 10.45% 11.57% 14.95% 10.71% 8.85% 10.02% 7.83% 6.18% 5.50% 6.44% 8.32% 7.86% 5.65% 3.54% 2.97% 3.91% 5.58% 5.50% 5.32% 5.11% 4.80% 5.226% D -1.20% -6.52% 12.69% 17.47% 5.55% 1.40% 5.53% 8.50% 11.07% 0.90% -4.16% 9.02% 13.17% 3.61% 6.52% -0.53% 15.29% 32.68% 23.96% -2.65% 8.40% 19.49% 7.13% 18.39% 7.79% 15.48% -7.18% 31.67% -0.81% 15.08% 13.52% -8.74% 5.936% E 11.00% -8.33% 4.10% 14.17% 19.14% -14.75% -26.40% 37 26% 23.98% -7.26% 6.50% 18.77% 32.48% -4.98% 22.09% 22.37% 6.46% 32.00% 18.40% 5.34% 16.86% 31.34% -3.20% 30.66% 7.71% 9.87% 1.29% 37.71% 23.07% 33.17% 28.58% 21.04% 14.890% 50.61% -32.27% -16.54% 18.44% -0.62% -40.54% -29.74% 69.54% 54.81% 22.02% 22.29% 43.99% 35.34% 7.79% 27.44% 34.49% - 14.02% 28.21% 3.40% -13.95% 21.72% 8.37% -27.08% 50.24% 27.84% 20.30% -3.34% 33 21% 16.50% 22.36% -2.55% 21.26% 17.103% 2.980% 9.493% 16.695% 29.043% Note: Sources for annual returns are the Center for Research on Security Prices, Standard & Poor's 500 index, Russell 2000 index, and Solomon Smith Barney US Treasury bill index
Step by Step Solution
There are 3 Steps involved in it

Get step-by-step solutions from verified subject matter experts