

Question: 5. Plot the following function using MATLAB f(x) = x+3x +4x+2x+6 6. Plot the sinc(x) function with x values ranging from -5 to 5
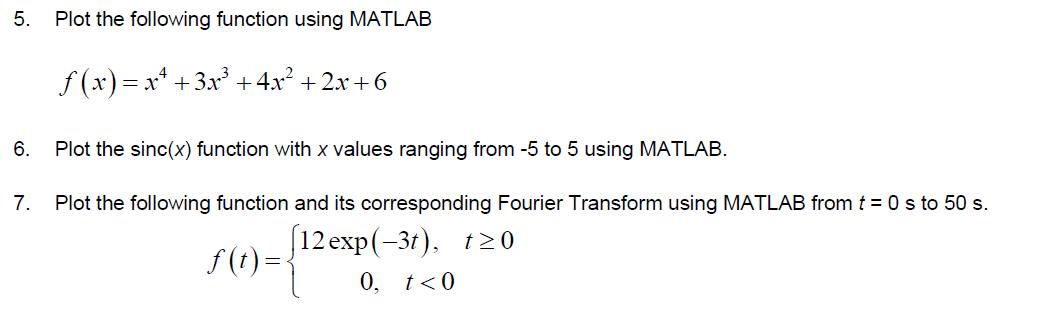
5. Plot the following function using MATLAB f(x) = x+3x +4x+2x+6 6. Plot the sinc(x) function with x values ranging from -5 to 5 using MATLAB. 7. Plot the following function and its corresponding Fourier Transform using MATLAB from t = 0 s to 50 s. [12 exp(-3t), t0 f(t) = 0, t
Step by Step Solution
★★★★★
3.51 Rating (151 Votes )
There are 3 Steps involved in it
1 Expert Approved Answer
Step: 1 Unlock

Question Has Been Solved by an Expert!
Get step-by-step solutions from verified subject matter experts
Step: 2 Unlock
Step: 3 Unlock